
Figures & data
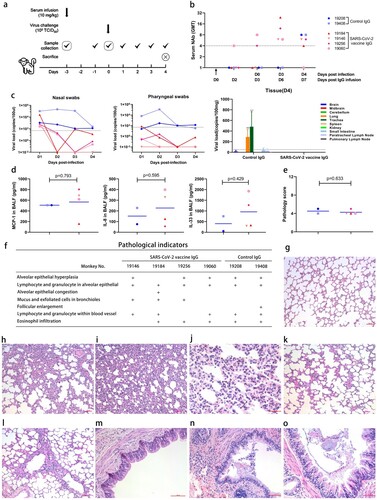
Figure 1. Protection against infection upon SARS-CoV-2 challenge provided by waning antibodies from inactivated SARS-CoV-2 vaccination in rhesus macaques. (a) Scheme of the experimental design. (b) Serum neutralizing antibody (NAb) geometric mean titres (GMTs) before and after virus challenge. Each point represents one animal. A titre of neutralizing antibodies less than 1:4 was designated negative (value = 1) in the GMT calculation. (c) Viral loads at the indicated time points (for nasal swabs and pharyngeal swabs, each line represents one animal) and on sacrifice day (for different tissues, the results for each group are presented as means ± SDs). A viral copy number of less than 50copies/100μl or 50copies/100 mg (dotted lines) was considered negative. (d) Proinflammatory mediator concentrations in bronchoalveolar lavage fluid (BALF) on the sacrifice day. Duplicate wells were performed in all experiments, each point represents average value for duplicate wells. (e) Pathology score. The average estimated severity of the lesions was determined by two pathologists in at least five areas at 100x as well as 200× magnification and scored as 1 (weak), 2 (moderate) or 3 (severe); and the total score was calculated by adding the scores of the left & right lung and superior & inferior lobe of each animal. Each point represents one animal. (f) Pathological indicators of each animal lung tissue with H&E staining. (g) Normal alveoli. (h) Mild alveolar epithelial hyperplasia. (i) Moderate alveolar epithelial hyperplasia. (j) Eosinophil infiltration indicated by arrows. (k) Alveolar epithelial congestion. (l) Alveolar epithelial oedema. (m) Normal bronchioles. (n) Exfoliated cells in bronchioles. (o) Mucus and exfoliated cells in bronchioles. All of the bars in the low right corner=100 µm except for that in j, which is 50 μm. Two-way ANOVA was used for the viral loads on sacrifice day for different tissues to compare the difference between the experiment and control group (c). The t test was used for the ELISA and pathology score to compare the difference between the experiment and control group (d and e). ***p < 0.001 versus the control group.