Figures & data
Figure 1. Phage Phab24 and effect on A. baumannii strain growth dynamics. (A) Transmission electron micrograph of Phab24 (negative staining). Phage Phab24 belongs to Myoviridae which have contractile tails (as seen on the rightside virion). Bar: 200 nm. (B) Growth curves of the A. baumannii reference strain ATCC17978 and phage-resistant reconstructed strains with introduced genomic mutations in the putative capsular biosynthesis gene gtr9 or in the putative LOS biogenesis gene gtrOC3, and their plasmid-complementations (::gtr9 and::gtrOC3) in the presence or absence of phage Phab24. (C) Spot testing of Phab24 on agar containing either phage-resistant or susceptible strains.
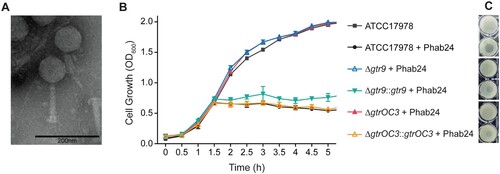
Table 1. Resistant strains and mutations conveying phage resistance and outcome of wildtype gene complementations in trans.
Figure 2. Attachment assay of Phab24 to bacteria. Titre of free phages detected in media after incubation with (A) reference strain ATCC17978, colistin resistant derivate XH198, the gtr9 and gtrOC3 genetically engineered strains (Δ), and their complementations (::); and (B) Phab24 phage-resistant colonies, “R”, derived from ATCC17978. Control: phage Phab24 incubated without bacteria. XH194: bacterial strain that is colistin resistant and is not infected by Phab24.
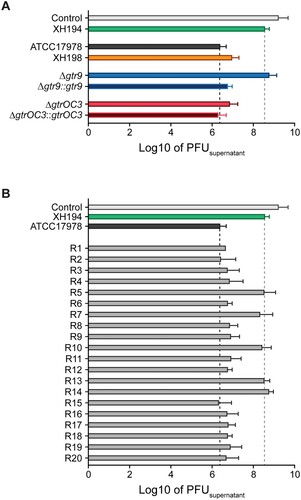
Figure 3. Composition of the bacterial envelope in parental and phage-resistant A. baumannii. (A–C) Mass spectrometry (positive mode) analysis of lipid A isolated using aqueous phenol extraction from (A) Wildtype strain ATCC17978, (B) Phab24 resistant, genetically introduced reconstructed gtrOC3 gene mutant on ATCC17978, (C) Plasmid complemented Phab24 resistant strain. (D and E) SDS-PAGE gel of isolated capsular polysaccharides stained with (D) Alcian blue, which allows the detection of acidic polysaccharides, and (E) silver staining, which detects lipids and proteins/peptides.
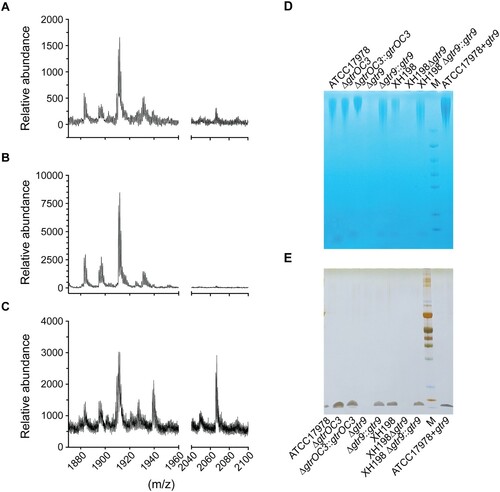
Figure 4. Surface structure of bacterial cell envelope. Scanning Electron Microscopy. ΔgtrOC3: knock-out of gtrOC3 gene in the ATCC17978. ΔgtrOC3::gtrOC3: knock-out of gtrOC3 gene which was complemented with the wildtype gtrOC3 gene in trans. Δgtr9: knock-out of gtr9 gene in the ATCC17978. Δgtr9::gtr9: knock-out of gtr9 gene which was complemented with the wildtype gtr9 gene in trans.
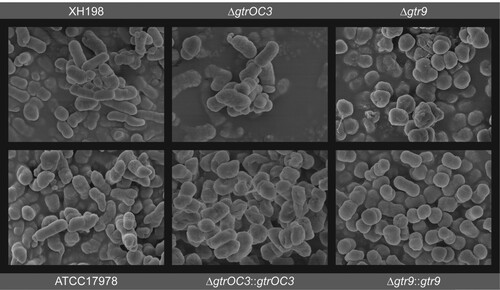
Figure 5. Biofilm formation and capsular stain. (A) Biofilm formation assessed by the ability to retain crystal violet (CV) dye. Strains were incubated for 72 hours in multi well plates without shaking. (B) Capsule stain of planktonic cells incubated for 8 hours with shaking. Cells were stained with CV to determine the ability of the bacterial capsule to retain the dye. Ethanol was used to destain the capsule and release the CV dye which was then detected by measuring absorbance at 540nm.
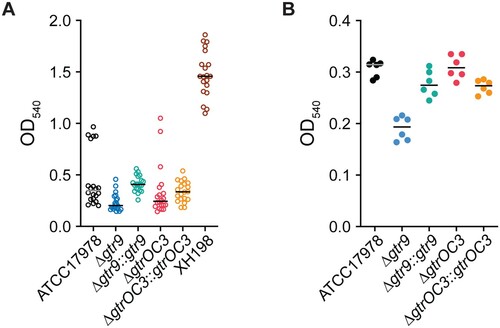
Figure 6. In vivo virulence tests of A. baumannii strains and the Phab24 resistant isolates. Survival of G. melonella larvae over 120 h after injection with (A) 106 colony forming units (CFU), (B) 107 CFU, and (C) 108 CFU of A. baumannii strains. Each group consisted of 10 larvae. Shown is a representative experiment of 4 independent repeats.
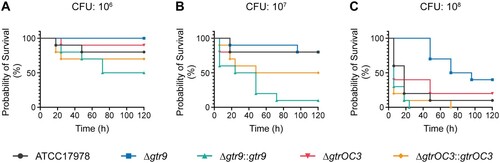
Figure 7. Colistin and Phage resistance. (A) Synergy of colistin with/without phage Phab24. Co-incubation of different numbers of Phab24 (MOI) at different concentrations of colistin (mg/L) at constant cell numbers. Each circle represents an independent experiment. (B and C) Colistin-resistance levels of emerged phage-resistant colonies. Colony count of XH198 incubated for 3 h in the absence of colistin or on colistin plates with different antibiotic concentrations (B) in the absence of phage, and (C) in the presence of Phab24. (D) Colistin MIC of selected Phab24 resistant isolates. Top panel shows if the strain can be infected by Phab24, indicating successful complementation of a mutated gene. The control, strain XH198, exhibits a MIC of 64 mg/L. Phage-resistant isolates displayed reduced levels of resistance varying from 16 to 1 mg/L, except for one strain (R81). The reconstructed gtr9 mutant shows an increased sensitivity to colistin compared to the reference strain XH198, while plasmid complementation with the wildtype gene fully restores the high level of resistance. The genetic deletion of the entire gtrOC3 gene in XH198 does not result in a reduction in colistin resistance. However, strains with mutations that lead to a truncated gtrOC3 gene product increase colistin sensitivity by 32-fold (R518, R587).
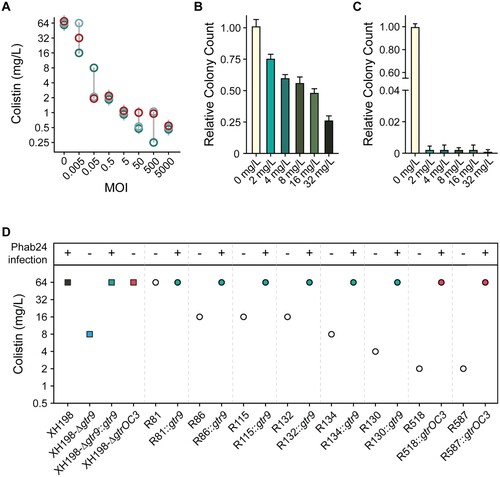
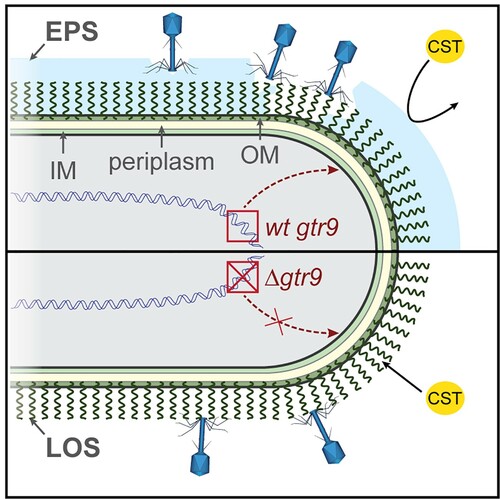
Figure 8. Model of Phab24 binding to ATCC17978/ XH198 and gtr9 mutants. Phages can bind to the capsule surrounding the cell (top, light blue) as well as to LOS molecules anchored in the outer membrane (OM). In the case of cells in which gtr9 is disrupted or mutated, phage particles may not bind to the cells via the LOS molecules (bottom). When the capsule is missing, colistin (CST) is able to bind to the OM more easily as the absence of a barrier facilitates diffusion to the membrane. IM: inner membrane; EPS: Extracellular polymeric substance.