
Figures & data
Figure 1. Geographical location of the human BoDV-1 encephalitis cases of this report and other cases with known county of residence (published/notified) in relation to the virus-endemic area. The human cases reported in this study are shown together with previously published BoDV-1 infections of humans (yellow and orange squares) in the map. The area known to be endemic for animal Borna disease or presence of BoDV-1 positive shrews is represented by the two shades of blue (*Source: https://www.rki.de/DE/Content/InfAZ/B/Bornavirus/Merkblatt.pdf?__blob=publicationFile).

Figure 2. Cranial magnetic resonance imaging of case 1. The typical affection of the basal ganglia (arrows) as found in acute BoDV-1 encephalitis [Citation10] is shown in this case of a probable BoDV-1 encephalitis according to the case definition criteria [Citation7]. Transversal T2-weighted image.
![Figure 2. Cranial magnetic resonance imaging of case 1. The typical affection of the basal ganglia (arrows) as found in acute BoDV-1 encephalitis [Citation10] is shown in this case of a probable BoDV-1 encephalitis according to the case definition criteria [Citation7]. Transversal T2-weighted image.](/cms/asset/e5a5fc9a-026a-485e-8abe-52eb836ffb96/temi_a_2007737_f0002_ob.jpg)
Figure 3. Cranial magnetic resonance imaging of case 2. In this case of a confirmed BoDV-1 encephalitis, widespread increase of signal intensity, especially of the thalami (arrows) is detected. Transversal T2-weighted fluid attenuated image (FLAIR).
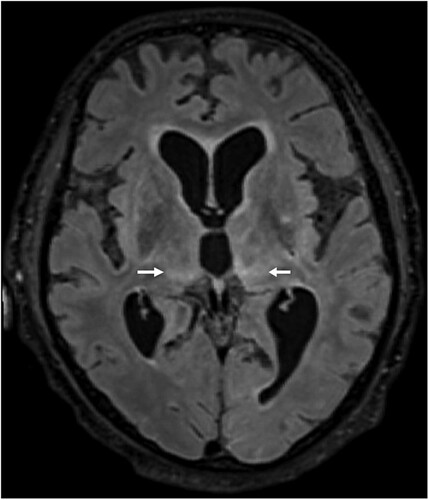
Figure 4. Histopathologic findings of BoDV-1 encephalitis (case 2). A, Severe inflammation as reflected by mononuclear cell infiltration and perivascular cuffing. Hematoxylin and eosin stain of the thalamus, original magnification ×50. B, Perivascular accumulation of B cells (CD20, blue) and T cells (CD3, red). While B cells demonstrated mainly perivascular cuffing, T cells were additionally infiltrating the brain parenchyma in high numbers. Immunoperoxidase and immunophosphatase stains of the hippocampus, original magnification ×100. C, Distribution of CD4+ (red) and CD8+ (blue) T lymphocytes in inflammatory infiltrates. Immunoperoxidase and immunophosphatase stains of the hippocampus, original magnification ×100. D, Microglia activation in inflamed regions of the brain. Immunoperoxidase stain for CD68 with hematoxylin counterstain of the thalamus, original magnification ×50.
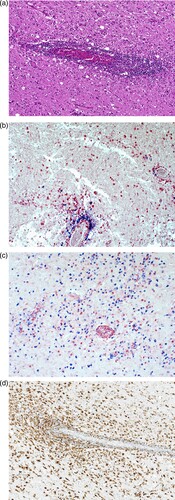
Figure 5. Detection of BoDV-1 antigen and RNA in brain tissue (case 2). A, Demonstration of viral antigen in neuropil and perikarya. Immunoperoxidase stain for BoDV-1 P antigen with light hematoxylin counterstain of the basal ganglia, original magnification x200. B, Presence of BoDV-1 antigen as spot-like nuclear inclusion or completely filling the nucleus. Immunoperoxidase stain for BoDV-1 P antigen with light hematoxylin counterstain of the pons, original magnification x1000. C, Detection of viral RNA. In situ-hybridization for BoDV-1 RNA of the hippocampus, original magnification x100. D, BoDV-1 RNA in the thalamus, in situ-hybridization, original magnification x100.
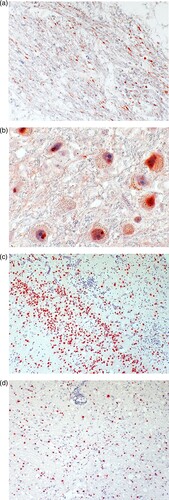
Figure 6. Maximum likelihood phylogenetic tree of BoDV-1 from Germany based on N and P gene nucleotide sequences (1824 nt, representing genome positions 54–1877 of BoDV-1 reference genome U04608). Cluster 1B (sequences from Switzerland) is shown in addition. Numbers at the nodes indicate maximum likelihood bootstrap replicates (>70%). GenBank accession number, host species, federal state and year of infection are provided per sequence. BoDV-1 sequences obtained from humans are shown in bold. The viral sequence of the case described herein is marked with an arrow, clustering with various animal sequences (cluster 4). Colour code of the clusters according to [Citation6,Citation7,Citation11]. The scale bar indicates nucleotide substitutions per site.
![Figure 6. Maximum likelihood phylogenetic tree of BoDV-1 from Germany based on N and P gene nucleotide sequences (1824 nt, representing genome positions 54–1877 of BoDV-1 reference genome U04608). Cluster 1B (sequences from Switzerland) is shown in addition. Numbers at the nodes indicate maximum likelihood bootstrap replicates (>70%). GenBank accession number, host species, federal state and year of infection are provided per sequence. BoDV-1 sequences obtained from humans are shown in bold. The viral sequence of the case described herein is marked with an arrow, clustering with various animal sequences (cluster 4). Colour code of the clusters according to [Citation6,Citation7,Citation11]. The scale bar indicates nucleotide substitutions per site.](/cms/asset/d53f995b-c52e-4f29-9330-15a946d1ba7c/temi_a_2007737_f0006_oc.jpg)