
Figures & data
Figure 1. Expression of GPI-scFvs in transduced TZM-bl cells and their effects on CD4, CCR5, and CXCR4. (A) Schematic diagram of lentiviral transfer vector expressing a GPI-scFv or bifunctional inhibitor. The encoding sequence of scFv or a bifunctional inhibitor was genetically linked with the sequences encoding a His tag and the GPI attachment signal of DAF. LTR, long terminal repeat; RRE, Rev response element; cPPT, central polypurine track; PGK, human PGK promoter; DAF, delay-accelerating factor; WPRE, woodchuck hepatitits virus posttranscription regulatory element. (B) The expression of GPI-scFvs on the surface of transduced TZM-bl cells with or without PI-PLC treatment was determined by FACS analysis using an anti-His tag antibody. (C) Effects of GPI-scFvs on the expression of HIV receptors. The expression levels of CD4, CCR5, and CXCR4 on the surface of GPI-scFv-transduced TZM-bl cells were detected by FACS analysis using a PE-conjugated anti-human CD4, CCR5, or CXCR4 antibody and judged by the fluorescence intensity.
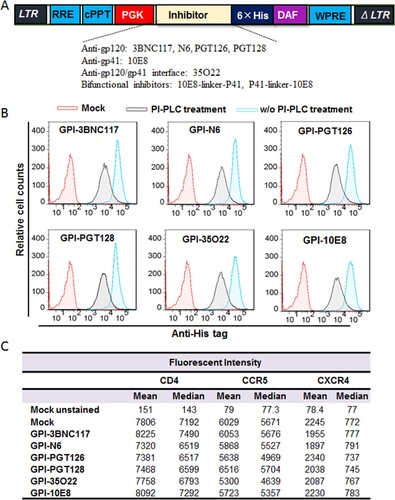
Figure 2. Confocal analyses of GPI-scFvs in transduced TZM-bl cells. Alexa555-CtxB stands for the lipid raft marker GM1 stained with Alexa 555-conjugated cholera toxin B subunit; Alexa488-Anti-His stands for the transduced cells stained with mouse anti-His tag antibody followed by Alexa 488-conjugated goat anti-mouse IgG antibody. Scale bar: 20 μm.
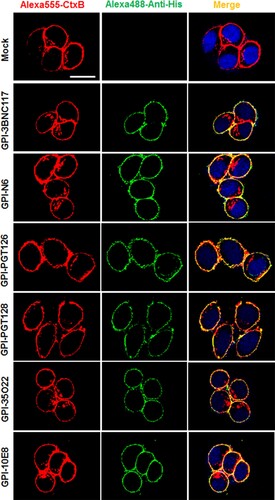
Table 1. Inhibitory activities of GPI-scFvs against HIV-1 infection and Env-mediated cell-cell fusion.
Figure 3. Anti-HIV activities of GPI-scFvs in transduced cells. The inhibitory activities of GPI-scFvs against a panel of replication-competent HIV-1 isolates (A), the “global panel” of HIV-1 pseudoviruses (B), and viral Env-mediated cell-cell fusion (C) in were summarized for convenient overall view. Error bars indicate the means ± standard deviations (SD). (D-F) The inhibitory activities of GPI-scFvs on cell-cell HIV-1 transmission. TZM-bl cells expressing GPI-scFvs were used as a target and cocultured with CEMss-CCR5 donor cells that were preinfected with the HIV-1 isolates RHPA.c/2635 (D), THRO.c/2626 (E) and MJ4 (F). % cell-cell transmission was monitored by quantifying the production of the reporter luciferase in TZM-bl cells. Error bars indicate the means ± standard deviations (SD) from three independent experiments with triplicate samples, and statistical comparisons relative to the GPI-FluIgG03 control were conducted by ANOVA (ns, not significant; *, P< 0.05; **, P < 0.01; ***, P < 0.001; ****, P < 0.0001).
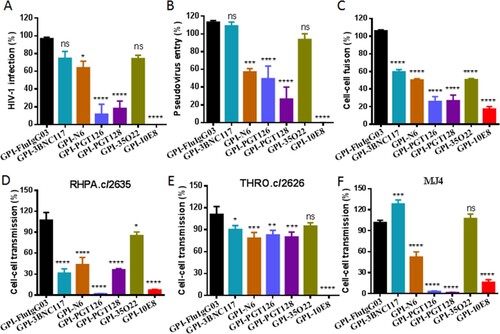
Figure 4. Inhibitory activity of GPI-10E8 in transduced human CD4+ T cells against CXCR4-tropic and CCR5-tropic HIV-1 isolates. CEMss-CCR5 cells transduced with GPI-10E8/GFP or GPI-FluIgG03/GFP were infected with 1,000 TCID50 of NL4-3 (A), SG3.1 (B), MJ4 (C), or RHPA.c/2635 (D) and intracellular HIV-1 p24 antigen and GFP expression were monitored over time by flow cytometry. (E) Infection curves of the transduced CEMss-CCR5 cells. Data from a representative experiment of at least two independent experiments are shown.
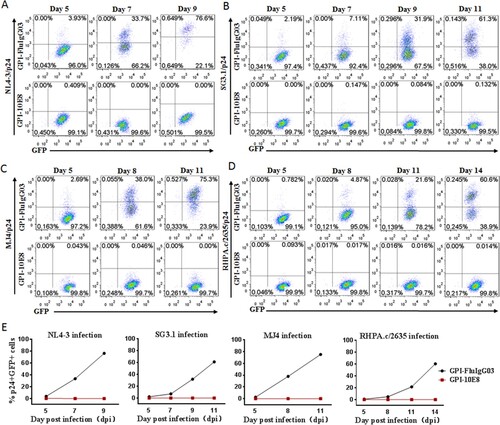
Figure 5. Selective survival of human CD4+ T cells expressing GPI-10E8 during CXCR4-tropic or CCR5-tropic HIV-1 infection. CEMss-CCR5 cells were transduced with GPI-10E8/GFP and mixed with untransduced cells at a ratio of approximately 20% GFP-positive cells. The mixed population was challenged with 1,000 TCID50 of CXCR4-tropic NL4-3 (A) or CCR5-tropic RHPA.c/2635 (B), and the proportion of transgene-expressing cells was monitored over time by flow cytometry. (C) Survival curve of the transduced CEMss-CCR5 cells. Data from a representative experiment of at least two independent experiments are shown.
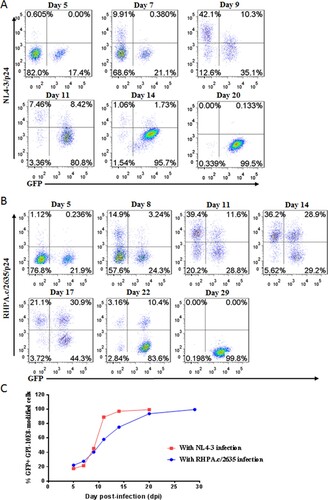
Figure 6. Design and characterization of GPI-anchored bifunctional inhibitors targeting gp41. (A) Design strategy. The sequence of a fusion inhibitor peptide P41 was genetically connected to the N- or C-termini of 10E8 scFv through a flexible (GGGGS)n linker, generating eight GPI-anchored bifunctional constructs named CMI01 ∼ CMI08. (B) The expression of CMI constructs was detected in the cell lysates and culture supernatants of transduced TZM-bl cells by western blotting with an anti-His tag antibody. (C) Surface expression of CMI constructs in transduced TZM-bl cells with or without PI-PLC treatment was determined by FACS analysis using an anti-His tag antibody. (D) Effects of CMI constructs on the surface expression of CD4, CCR5, and CXCR4 in transduced TZM-bl cells were detected by FACS analysis using a PE-conjugated anti-human CD4, CCR5, or CXCR4 antibody and judged by fluorescence intensity.
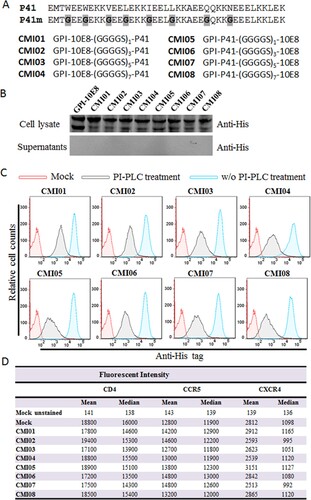
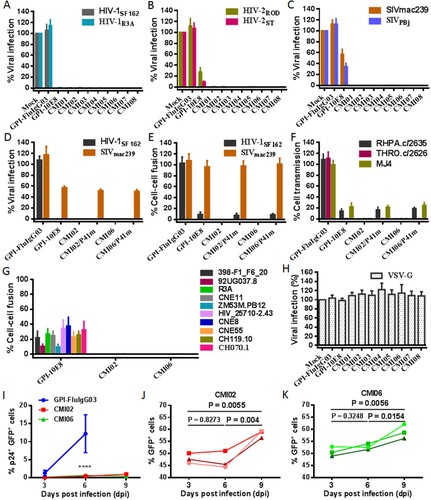
Figure 7. Antiviral activity of GPI-anchored bifunctional inhibitors in transduced cells. The inhibitory activities of CMI constructs against two HIV-1 pseudoviruses (A), two replicative HIV-2 isolates (B), and two SIV pseudoviruses (C), as well as the inhibitory activities of the CMI02 and CMI06 mutants with the disruptive P41 mutations on the HIV-1SF162 and SIVmac239 pseudoviruses (D) and their Env-mediated cell-cell fusion (E), and the cell-cell HIV-1 transmission of three replicative HIV-1 isolates (F) were respectively determined in transduced TZM-bl or 293FTtarget cells. (G) The inhibitory activities of CMI02 and CMI06 constructs against the cell-cell fusion mediated by a panel of HIV-1 Envs that were partially resistant to GPI-10E8. (H) The inhibitory activities of GPI-10E8 and CMI constructs on VSV-G infection. (I-K) The anti-HIV activities of CMI02 and CMI06 in human primary CD4+ T cells. Transduced human primary CD4+ T cells were infected with 1,000 TCID50 of NL4-3, and intracellular p24 and GFP expression were monitored over time by flow cytometry. Infection curves of the transduced CD4+ T cells (I) represent the means ± SD from three independent experiments with triplicate samples, and statistical comparison was only performed between GPI-FluIgG03-ransduced cells and CMI02 or CMI06-transduced cells at day 6 after NL4-3 infection (****, P < 0.0001) as the most GPI-FluIgG03-transduced cells were dead at day 9. The survival curves of human CD4+ T cells transduced with CMI02 (J) and CMI06 (K) were statistically analyzed. The results of three independent experiments are shown with different colours of lines.
Supplemental Material
Download Zip (8.6 MB)Data availability statement
All data are fully available without restriction.