
Figures & data
Figure 1. Weekly distribution of received and SARS-CoV-2 laboratory-confirmed specimens from Hospitals (green) and Primary Care Centres (brown). Lockdown and the different de-escalation phases are labelled in colours. Vaccine coverages from people living in Barcelona are represented by dot line (for one dose) and dash line (for two doses).
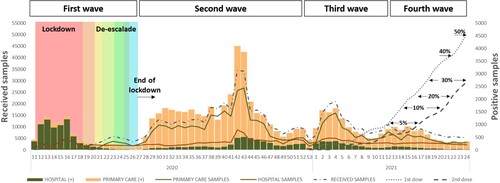
Table 1. Distribution of received and SARS-CoV-2 laboratory-confirmed specimens per origin, age group, and sex in each pandemic wave.
Figure 2. Weekly distribution of the different lineages during the study period (weeks 11/2020–24/2021) labelled in colours. Dashed line represents all SARS-CoV-2 laboratory-confirmed samples. Those prevalent lineages in each pandemic wave are blue squared.
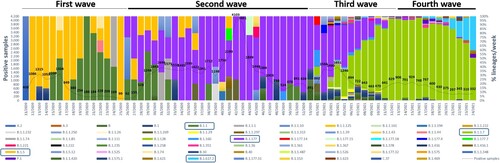
Table 2. Lineage observation overall, and per pandemic wave during the study period (% per pandemic wave).
Table 3. Evolutionary divergences on whole viral (29764 nt) and Spike (3822 nt) sequences within and between waves.