Figures & data
Figure 1. Genome editing strategy and characterization of MDBK CD46-knockout cells. (A) CRISPR/Cas9 genome editing strategy and genetic characterization of generated MDBK CD46-knockout (MDBKΔCD46) cells. The MDBK wild type (WT) consensus nucleotide sequence and deduced amino acid sequence are shown in the top rows. Sequences encoding the CD46bov signal peptide (SP), the complement control protein domains 1 and 3 (CCP1 and -3) as well as the guide RNA (highlighted in grey) and its protospacer adjacent motif (PAM, boxed) are indicated. Nucleotide sequences obtained from MDBKΔCD46 (ΔCD46) cells and resulting amino acid sequences are shown below. Deletions of five and two nucleotides (Δ5nt and Δ2nt, respectively) and stop codons (*) are indicated. (B) Phenotypic characterization of MDBKΔCD46 cells. CD46bov expression of MDBK WT and MDBKΔCD46 cells was detected by immunofluorescence staining of CCP1 (mab CA 26/2/5) and CCP2 (mab CA 17/2/1). Nuclei were stained with DAPI (blue) to visualize the presence of confluent cell monolayers (small pictures in lower left corners).
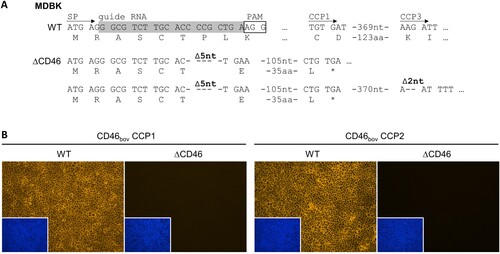
Table 1. Oligonucleotides / primers used in this study.
Figure 2. Heparan sulfate adaptation of Pestivirus H and Pestivirus G strains used in this study. (A) MDBK wild type (WT) cells were infected with HoBi-like pestivirus strains HoBi and HaVi-20, and giraffe pestivirus strains H138 and PG-2. Native infections (- Hep, top row) were compared with infections after pre-incubation of virus inocula with heparin (+ Hep, bottom row), respectively. For immunofluorescence analysis, pestivirus non-structural protein NS3 was visualized using mab C16 in combination with secondary mab Cy3-AffiniPure goat anti-mouse IgG (orange). Nuclei were stained with DAPI (blue) to visualize the presence of confluent cell monolayers (small pictures in lower left corners). (B) Infections were quantified by pixel counting using the ImageJ software. Bars represent mean values from five pictures per well. Standard deviations are indicated. Native infections (- Hep) were set as 100% and infections after pre-incubation with heparin (+ Hep) were put in relation. Significance was calculated using a permutation test (*p < 0.05; **p < 0.01).
Figure 3. Impact of CD46-deficiency on entry of Pestivirus H and Pestivirus G strains. (A) MDBK wild type (WT) and MDBK CD46-knockout (ΔCD46) cells were infected with BVDV-1 strain NADL, BVDV-2 strain CS8644, HoBi-like pestivirus strains HoBi and HaVi-20, and giraffe pestivirus strains H138 and PG-2 for 16 h. Partially cell-culture-adapted PG-2 was pre-incubated with heparin (+ Hep) to block binding to heparan sulfate. Immunofluorescence staining of pestivirus non-structural protein NS3 was performed using mab C16 in combination with secondary mab Cy3-AffiniPure goat anti-mouse IgG (orange). Nuclei were stained with DAPI (blue) to visualize the presence of confluent cell monolayers (small pictures in lower left corners). (B) Infections were quantified by pixel counting using the ImageJ software. Bars represent mean values from five pictures per well. Standard deviations are indicated. Infections of MDBK WT cells were set as 100% and infections of MDBKΔCD46 cells were put in relation. Significance was calculated using a permutation test (**p < 0.01).
Figure 4. Trans-complementation strategy and characterization of MDBKΔCD46 rescue cell lines expressing CD46bov. (A) For trans-complementation of CD46bov via lentiviral transduction, the guide RNA target sequence within the signal peptide (SP) coding region was altered by introduction of six silent mutations (underlined nucleotides in “complemented” sequence). (B) Different domains of CD46bov including signal peptide (SP), complement control protein 1–4 (CCP1-4), Serine/Threonine/Proline-rich region (STP) and cytoplasmic tail (CT) are shown. Trans-complementation was performed using recombinant lentiviruses carrying two genetically distinct CD46bov transcript variants, one with a long (CD46-CTL: 33 aa) and one with a short (CD46-CTS: 9 aa) CT. Apart from their CTs, CD46-CTL and -CTS differ in 13 aa within SP-CCP4 as well as in the length of the variable STP domain. Most similar SP-CCP4 sequences identified in GenBank (reference; CD46-CTL: DAA20944, CD46-CTS: AIC33504) differ in only one aa. Residues identical to CD46-CTL and CD46-CTS are indicated, respectively (*). (C) Phenotypic characterization of MDBKΔCD46 CD46-rescue cell lines. CD46bov expression of MDBK WT (WT), MDBKΔCD46 (ΔCD46) and CD46-rescue cell lines (CD46-CTL, CD46-CTS) was detected by immunofluorescence staining of CCP1 (mab CA 26/2/5). Nuclei were stained with DAPI (blue) to visualize the presence of confluent cell monolayers (small pictures in lower left corners).
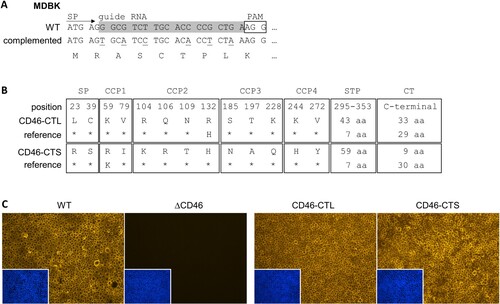
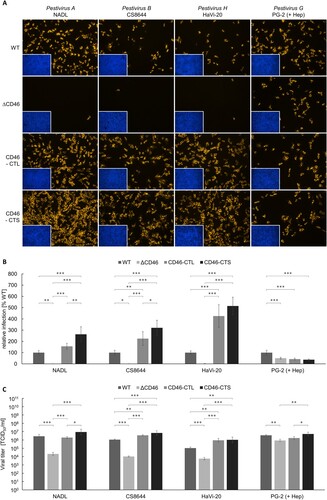
Figure 5. Impact of CD46-rescue on entry of Pestivirus H and Pestivirus G strains. (A) MDBK wild type (WT), MDBK CD46-knockout (ΔCD46) and MDBKΔCD46 cells trans-complemented with CD46bov comprising either a long (CD46-CTL) or a short cytoplasmic tail (CD46-CTS) were infected with BVDV-1 strain NADL, BVDV-2 strain CS8644, HoBi-like pestivirus strain HaVi-20 and giraffe pestivirus strain PG-2 and incubated for 16 h, respectively. Partially cell-culture-adapted strain PG-2 was pre-incubated with heparin (+ Hep) to block binding to heparan sulfate. Immunofluorescence staining of pestivirus non-structural protein NS3 was performed using mab C16 in combination with secondary mab Cy3-AffiniPure goat anti-mouse IgG (orange). Nuclei were stained with DAPI (blue) to visualize the presence of confluent cell monolayers (small pictures in lower left corners). (B) Infections were quantified by pixel counting using the ImageJ software. Bars represent mean values from five pictures per well. Standard deviations are indicated. Infections of MDBK WT cells were set as 100% and infections of the other cell lines were put in relation. (C) Infectious viral titres were determined by titration of supernatants from infection experiments. Bars represent mean 50% tissue culture infectious doses per ml (TCID50/ml) from three titrations each performed in quadruplicate. Standard deviations are indicated. (B+C) Significance was tested using one-way ANOVAs with Tukey post-hoc tests (*p < 0.05; **p < 0.01; ***p < 0.001).