
Figures & data
Table 1. Comparison of the minimum inhibitory concentrations and resistance rates of capsule locus 2 (KL2) and non-capsule locus 2 (non-KL2) isolates of Acinetobacter baumannii.
Table 2. Demographics and clinical characteristics of patients with Acinetobacter baumannii bacteraemia.
Figure 1. Kaplan–Meier survival curves in patients with Acinetobacter baumannii bacteraemia. (A) Comparison between the capsule locus 2 (KL2) and non-capsule locus 2 (non-KL2) groups. (B) Comparison between the multilocus sequence type 2 (ST2), non-sequence type 2 (non-ST2), capsule locus 2 (KL2) and non-capsule locus 2 (non-KL2) groups at 28 days. aHR adjusted hazard ratio.
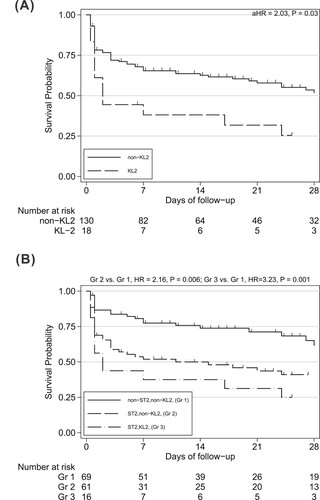
Table 3. Multivariate Cox proportional hazard model analysis of the factors predicting mortality of patients with A. baumannii bacteraemia.