Figures & data
Figure 1. Schematic of JEV 3′ UTR and deletion mutants. (A) Secondary structure diagram of JEV SA14 full-length 3′ UTR. Three domains are divided into purple, orange or green boxes, respectively. Stem-loop (SL), dumbbell (DB) structures, conserved sequences (CS) or repeated CS (RCS) were shown in order. (B) Systematic presentation of deletion mutants in SL and DB domains which are divided into four groups: individual structure deletion in domain SL, individual structure deletion in domain DB, combined structures deletion in domain SL, and large fragment deletion in SL and DB domains. Deletion sequences were exhibited in blank frames, and the details of missing locations in the genome were labelled.
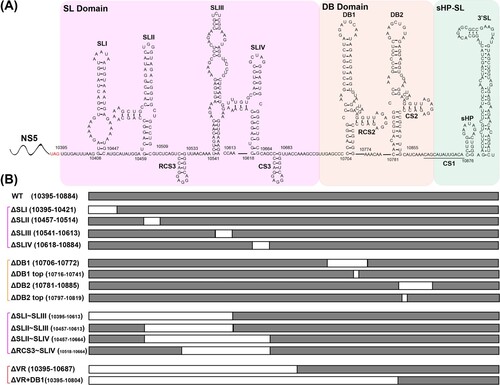
Figure 2. Detection of virus replication of different 3′ UTR deletion mutants in BHK-21 and C6/36 cells. (A) Equal amounts of wild-type (WT) or single structure deletion mutant RNAs in SL domain (ΔSLI, ΔSLII, ΔSLIII and ΔSLIV) were transfected into BHK-21 and C6/36 cells, respectively. Transfected cells were fixed at 48 and 72 h post transfection (hpt) in BHK-21 cells and at 72 and 96 hpt in C6/36 cells, respectively. The expression of E protein at the indicated time points was detected by IFA. The 4G2 monoclonal antibody and FITC-conjugated goat anti-mouse IgG were used as primary and secondary antibodies, respectively. (B) Growth kinetics of the WT and ΔSLI, ΔSLII, ΔSLIII, ΔSLIV mutant viruses in BHK-21 and C6/36 cells infected with the same MOI of 0.1. (C) IFA results of the transfected BHK-21 and C6/36 cells with WT, ΔDB1, ΔDB1 top, ΔDB2 or ΔDB2 top mutant RNAs, respectively. (D) Growth kinetics of WT, ΔDB1, ΔDB1 top, ΔDB2 and ΔDB2 top mutant viruses in BHK-21 and C6/36 cells infected with the same MOI of 0.1. (E) The expression of E protein was detected by IFA in the BHK-21 and C6/36 cells transfected with WT or combined structures deletion (ΔSLI∼SLIII, ΔSLII∼SLIII, ΔSLII∼SLIV and ΔRCS3∼SLIV) mutant RNAs, respectively. (F) Growth curves of WT and several structures deletion (ΔSLI∼SLIII, ΔSLII∼SLIII, ΔSLII∼SLIV, and ΔRCS3∼SLIV) mutant viruses in BHK-21 and C6/36 cells infected with the same MOI of 0.1. (G) The E protein expression of the WT, ΔVR and ΔVR + DB1 mutants in transfected and infected BHK-21 and C6/36 cells. After the mutant RNAs were transfected into BHK-21 and C6/36 cells, the cells were fixed at the indicated time points and subjected to IFA assay to determine the E protein expression and the supernatants were harvested and used to infect naïve BHK-21 and C6/36 cells, and the expression of E protein was detected at 72 and 96 hpi for BHK-21 and C6/36 cells, respectively. (H) Growth kinetics of WT and ΔVR mutant viruses in BHK-21 and C6/36 cells infected with an MOI of 0.1. n.s., indicates no statistical differences. *p < 0.05, **p < 0.01, *** p < 0.001.
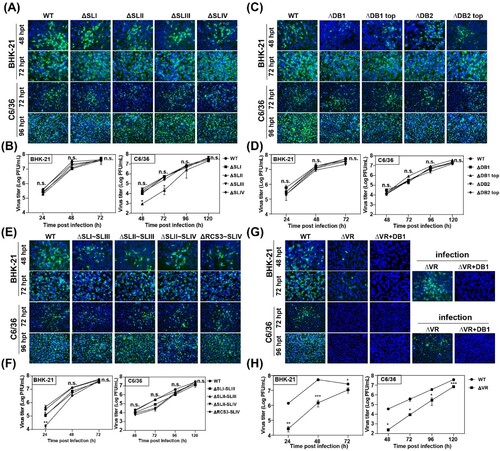
Figure 3. Characterization of ΔVR mutants passaged virus. (A) Schematic diagram of ΔVR mutant virus passaging in BHK-21 cells. (B) Plaque morphologies of the WT, ΔVR and ΔVR-P12-A/B/C viruses in BHK-21 cells. (C) Growth kinetics comparison between WT and ΔVR-P12-A/B/C viruses in BHK-21 cells. The WT and ΔVR-P12-A/B/C viruses infected BHK-21 cells at an MOI of 0.1, respectively, and the viral growth kinetics were determined by titration of the supernatants harvested at the indicated time points after infection by plaque assay. n.s., indicates no statistical differences. *** p < 0.001. (D) RT–PCR detection of the adaptation variation of ΔVR mutant during passaging. The primer pair, JEV-9841-F and JEV-10977-R (Table S1), was used to amplify the fragment spanning the terminal portion of NS5 and the proximal region of 3′ UTR. (E) The sequencing results of 12 single clones of ΔVR-P12-A/B/C viruses were obtained by plaque purification. The RT–PCR product spanning from NS5 to 3′ UTR of each purified virus was subjected to the sequencing analysis, and the whole-genome sequencing was performed for ΔVR-P12-B virus.
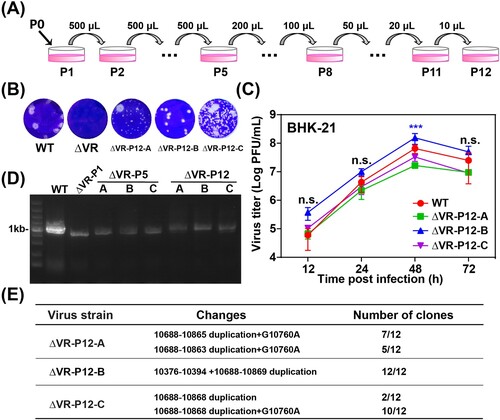
Figure 4. Diagram of 3′ UTR structure and sequences of passaged ΔVR-P12-A/B/C viruses. (A) Schematic of the 3′ UTR structure of JEV WT, ΔVR and ΔVR-P12 viruses. (B) Detailed 3′ UTR sequences of the representative clone of ΔVR-P12-A/B/C viruses were presented. There was a G10760A site mutation in the second DB1 structure in ΔVR-P12-A/C viruses, and there was an additional 19 nucleotides duplication within the C-terminus of NS5 in ΔVR-P12-B virus.
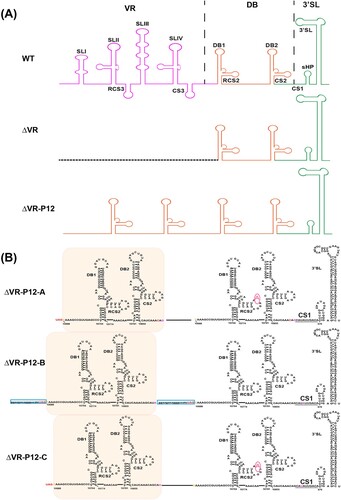
Figure 5. Characterization of the adaptive mutations of ΔVR revertant viruses on virus replication and sfRNA production. (A) The expression of E protein in the mutant RNAs-transfected BHK-21 cells. Equal amounts of the mutant RNAs derived from the full-length infectious clones were transfected into BHK-21 cells, and IFA was performed at the indicated time points. (B) Growth kinetics of ΔVR, DB-dup and WT viruses in BHK-21 cells. The supernatants from RNA-transfected cells at different time points were collected and subjected to plaque assay to determine the virus titres. n.s., indicates no statistical significance. *** p < 0.001. (C) Northern blotting analysis of the total RNAs extracted from BHK-21 cells infected with WT, DB-dup, and ΔVR-P12-B viruses, respectively. Bands intensities of sfRNAs and gRNA were quantified using Image J software, and the ratios of sfRNA1/gRNA were shown below.
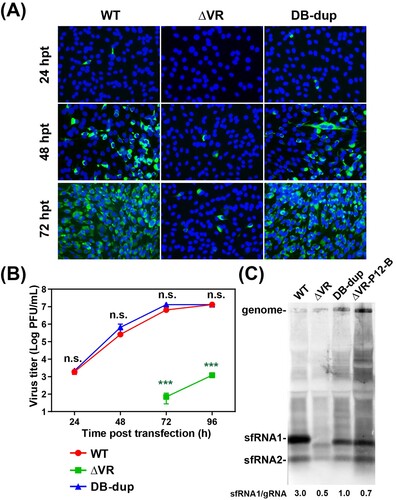
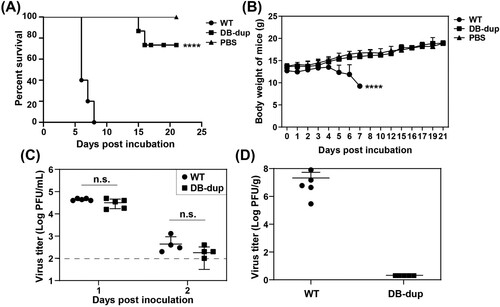
Figure 6. DB-dup mutation attenuated viral virulence in C57BL/6 mice. (A) Survival analysis of mice infected with WT and DB-dup viruses. Three-week-old C57BL/6 mice were i.p. inoculated with 1×10⁷ PFU of JEV WT and DB-dup virus, respectively, and then monitored for clinical symptoms and mortality over 21 days. The average survival rate of the infected mice from three independent assays was presented. **** p < 0.0001. (B) Body- weight changes of mice infected with JEV were monitored for 21 days. **** p < 0.0001. (C) Viremia on the first and the second days post infection by plaque assay in BHK-21 cells. The dotted line indicated the detection limit (100 PFU/mL). n.s., indicates no significant difference. (D) Virus loads in the brains of mice infected with WT virus at 6 dpi or in survived mice infected with DB-dup virus at 21 dpi.