
Figures & data
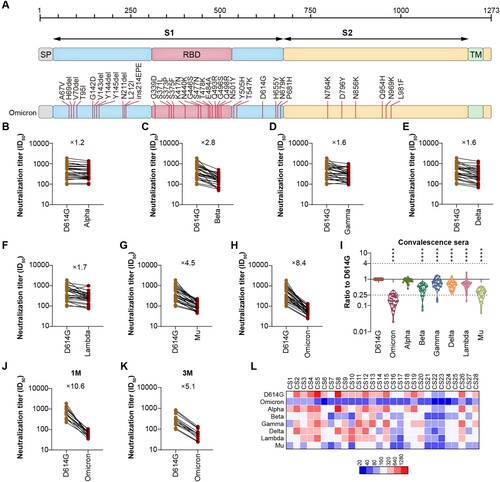
Figure 1. A. Schematic Illustration of Omicron Spike. All of the 32 mutations were located on Omicron Spike, which was used to construct the pseudotyped Omicron virus. B–H. The neutralization analysis of convalescent sera against Omicron, VOCs and VOIs. The neutralization activity of 28 convalescent sera from COVID-19 patients was tested. The neutralization ED50 and ratio compared to the reference strain D614G was also displayed as indicated. Data represented ED50 of three independent experiments. I. The comparison of neutralization activity against different VOCs and VOIs. J–K. The neutralization sensitivity of sera collected from convalescent patients at different time point against Omicron. The neutralization ED50 and ratio compared to the reference strain D614G was also displayed as indicated. Data represented ED50 of three independent experiments. J sera were collected 1-month after recovery; K, sera were collected 3-month after recovery; L. The heatmap of individual neutralization data. Data represented ED50 of three independent experiments. The Red to blue colour represented ED50 high to low as shown in the scale bar. CS1–15 sera were collected 1-month after recovery; CS16–28 sera were collected 3-month after recovery.