
Figures & data
Figure 1 . The 20 clinical isolates reflect the antigenic and geographic diversity of DENV. (A) Geographic distribution of the 20 clinical isolates. Block charts reflect frequencies of different viral serotypes originating from respective geographic regions (DENV-1, purple; DENV-2, blue; DENV-3, yellow; DENV-4, red). (B) Phylogenetic tree constructed using full-genome sequences of 5,448 published DENV strains and reference strains obtained from NCBI GenBank. The 20 clinical isolates are plotted in different colors on basis of serotype and used to infer comparative evolutionary history. Tree was drawn using the maximum likelihood method and scale expresses genetic distance.
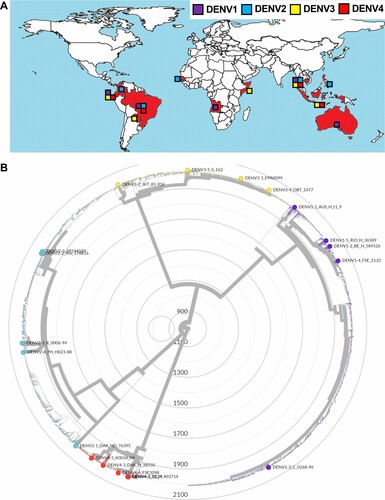
Table 1. Amino acid differences across the viral E proteins.
Figure 2 . 20 CPER-derived viruses mirror infection kinetics of the respective parental clinical isolates in human cell cultures. Huh7.5 cells were infected with the parental clinical isolates and CPER-derived viruses at an MOI of 0.1. Intracellular viral RNA (A) was determined at the indicated timepoints by RT-qPCR, and viral titers (B) were quantified by a focus-forming assay at 4 days post infection. Statistical significance was assessed using Student’s t test (Original vs CPER).
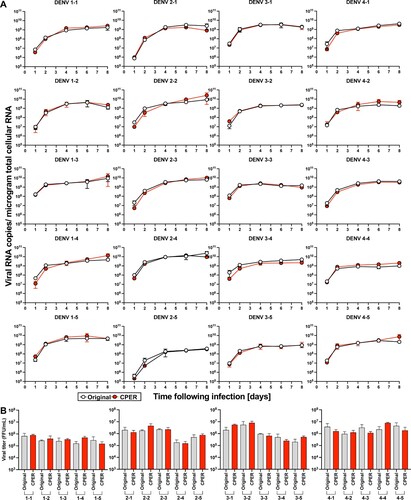
Figure 3 . CPER-derived viruses infect and replicate robustly mosquito cells. Mosquito-derived C6/36 cells were infected with the selected CPER-derived viruses from each serotype at an MOI of 0.1. Intracellular viral RNA (A) was determined at the indicated timepoints by RT-qPCR, and viral titers (B) were quantified by a focus-forming assay at 4 days post infection.
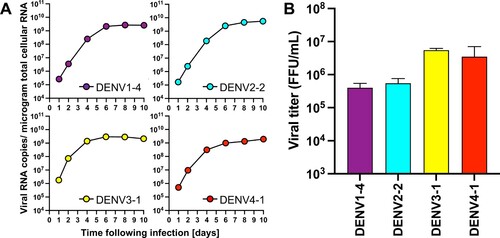
Figure 4 . CPER-derived DENV of all 4 serotypes establish infection in humanized mice. (A) Schematic overview for the generation of HIS-NFA2/hFLT3Lg mice utilized in the in vivo DENV experiments created with BioRender.com. (B) Four cohorts of mice were inoculated intravenously (i.v.) with 105 FFU of either DENV1 (n = 5, purple), DENV2 (n = 4, cyan), DENV3 (n = 4, yellow), or DENV4 (n = 5, red). Mice were bled at indicated timepoints post-infection, and viral RNA was extracted from plasma and quantified by RT-qPCR. Results are presented as copies of viral RNA per milliliter of plasma measured until 20 days post-infection. The dashed line represents the threshold for viral RNA detection (1,500 RNA copies/ml). Each symbol represents one mouse. (C) NS1 antigen in plasma was quantified by ELISA. (D) Correlation between chimerism (number of human CD45+ cells divided by total CD45+ cells) and viremia. Blood samples from DENV1-4 infected HIS-NFA2/hFLT3LG mice were collected at days 5, 10, 15, 20. Samples were stained for hCD45+ and mCD45+ to determine the human hematopoietic chimerism and viral RNA copies were quantified in serum by RT-qPCR. Symbols represent individual mouse, and the straight lines are the linear regression plotted between chimerism and viral RNA copy numbers (Pearson’s r values of 0.000009725). (E) Human platelet counts were assessed longitudinally over the course of 20 days after DENV-infection. Mice from each of the 4 experimental cohorts were bled at the indicated timepoints. Samples were stained for hCD41a+ to assess the absolute cell count per microliter of blood. The numbers are normalized on the day of DENV- infection (baseline). The numbers are normalized on the day of DENV- infection (baseline). Statistical significance was assessed using Friedman with Dunnett’s test (B, C, E) and is indicated by asterisks (*, compared between data at day 0 or baseline).
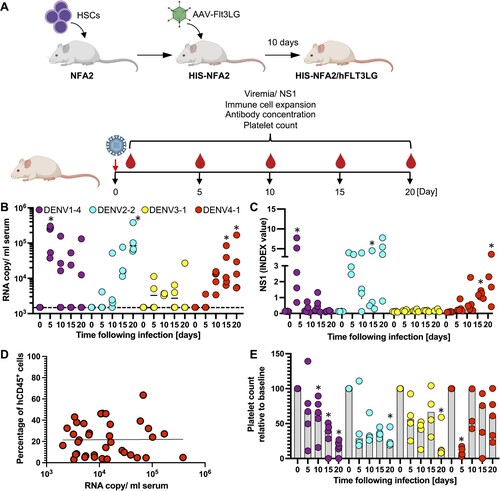
Figure 5 . Infection of humanized mice with DENV results in activation of T cells and immune responses. (A) Representative flow cytometry plots of CD38/HLA-DR gating, along with associated phenotypes. CD38 and HLA-DR expression was assessed among gated human CD8+ T-cells, and subsets were characterized as naïve (CD38– HLA-DR–) or activated (CD38+ HLA-DR+) [Citation43]. Frequencies of the activated subpopulation (CD38+ HLA-DR+) within CD8+ T cells in the plasma (B) are shown. All data is reported as frequencies of total CD45+ cells. Human DENV-specific IgM (C) IgG (D) antibodies circulating in sera of HIS-NFA2/hFLT3Lg mice infected with DENV. Both antibody levels were assessed using ELISA at days 0, 5, 10, 15, and 20 post-infection. Symbols represent individual mice and the median presented as a line per subset. Statistical significance was assessed using Friedman with Dunnett’s test (B, C, and D) and is indicated by asterisks (*, compared between data at day 0 or control cohort).
![Figure 5 . Infection of humanized mice with DENV results in activation of T cells and immune responses. (A) Representative flow cytometry plots of CD38/HLA-DR gating, along with associated phenotypes. CD38 and HLA-DR expression was assessed among gated human CD8+ T-cells, and subsets were characterized as naïve (CD38– HLA-DR–) or activated (CD38+ HLA-DR+) [Citation43]. Frequencies of the activated subpopulation (CD38+ HLA-DR+) within CD8+ T cells in the plasma (B) are shown. All data is reported as frequencies of total CD45+ cells. Human DENV-specific IgM (C) IgG (D) antibodies circulating in sera of HIS-NFA2/hFLT3Lg mice infected with DENV. Both antibody levels were assessed using ELISA at days 0, 5, 10, 15, and 20 post-infection. Symbols represent individual mice and the median presented as a line per subset. Statistical significance was assessed using Friedman with Dunnett’s test (B, C, and D) and is indicated by asterisks (*, compared between data at day 0 or control cohort).](/cms/asset/3c03edd9-f82c-4fd0-bcd2-82ba8f6ddab0/temi_a_2021808_f0005_oc.jpg)