Figures & data
Figure 1. The 2020 dengue epidemic in Yunnan, China, was reduced and confined to Ruili. (A) Annual case numbers in China since 2013. A predicted case number in 2020 by ARIMA model is shown as the dotted line. (B) The proportion of dengue cases in Yunnan to total numbers in China. (C) Annual case numbers in Yunnan since 2013. A predicted case number in 2020 by ARIMA model is shown as the dotted line. (D) The geographical distribution of dengue cases in Yunnan since 2013. Only top three affected cities were shown on the map, and the area of colour circles represent the logarithm of annual case numbers in the cities. The cases in the other cities were displayed together as brown square.
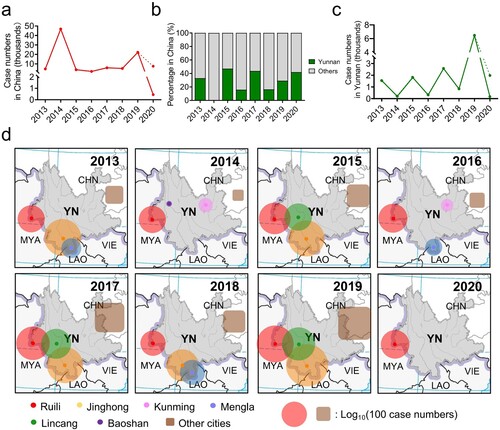
Figure 2. The geographical feature of Ruili facilitated the epidemics of dengue and COVID-19. (A) The study area. (B) The daily case number (columns in purple) and the accumulated numbers (line in red) in 2020 dengue epidemic in Ruili. The COVID-19 cases and measures taken against it were shown in boxes.
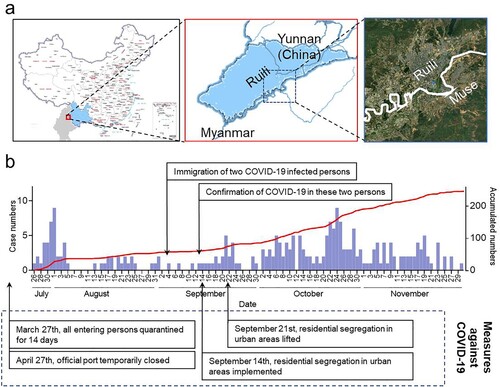
Figure 3. The distribution of dengue cases remained stable in Ruili urban area but reduced in the suburban area in 2020. (A) The clustering analysis of dengue cases by fishnet polygons in the urban region of Ruili from 2013 to 2020. Red spot indicates the location of the municipal government for reference. The spatial resolution of a grid is 0.5 km. Dengue case counts in each grid were counted and displayed in thermodynamic diagram. (B) The distribution of dengue cases in suburban area from 2013 to 2020. Standard distance (1 standard deviation) and standard deviation ellipse (1 standard deviation) are displayed as a blue circle and purple ellipse, respectively. The central feature (green circle), mean centre (blue square) and median centre (yellow triangle) were calculated by Euclidean distance to display the spatial distribution characteristics.
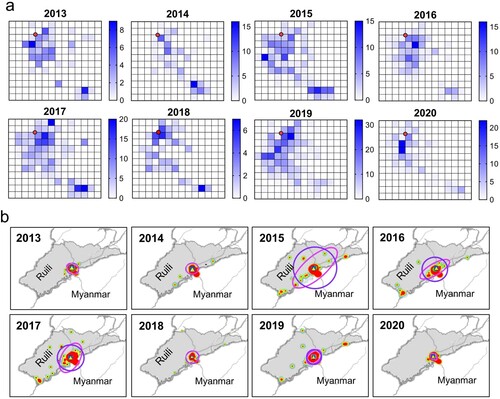
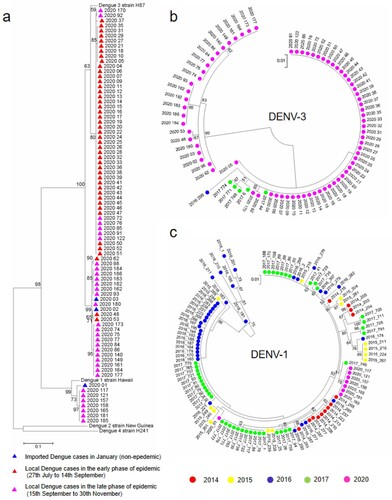
Figure 4. The phylogenetic analysis of dengue epidemic in Ruili city, 2020. (A) The phylogenetic analysis of the dengue epidemic based on CprM sequences in Ruili, 2020. Blue triangles indicated three cases in January. Red triangles indicated the cases in the early phase. Pink triangles indicated the cases in the late phase. (B) The phylogenetic analysis of DENV-3 sequence in 2020 and those detected previously in 2014 to 2017 in Ruili. (C) The phylogenetic analysis of DENV-1 sequence in 2020 and those detected previously in 2014 to 2017 in Ruili.