Figures & data
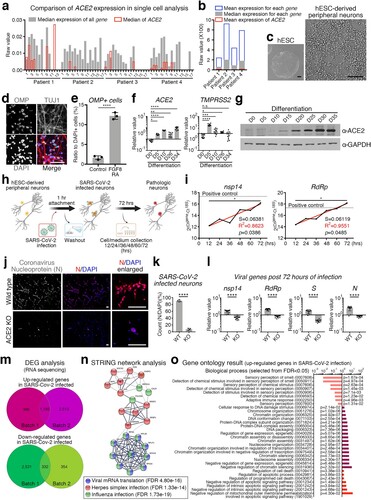
Figure 1. SARS-CoV-2-infected human peripheral sensory neurons reveal the cellular and molecular pathology of the chemosensory impairment. (a) Comparison of expression level of ACE2 to the expression level of all other genes in single cells. All single cells were divided into 14–18 groups for each patient according to the gene expression pattern, and the median value of all cells expressing ACE2 was indicated in red. (b) Comparison of expression level of ACE2 against the mean or median of each gene. Mean values of ACE2 expression in all cells of the indicated patients are shown in red. (c) Representative morphology of differentiated peripheral neurons. Scale bars correspond to 100 μm. (d) Representative image for OMP expressing neurons. TUJ1 and DAPI was counter stained. Scale bars correspond to 50 μm. (e) Cell counting for OMP expressing neurons to DAPI stained nuclei in the neuronal differentiation condition with or without FGF8 and RA. Unpaired t-test, ****p < 0.0001, (f) Transcription level of ACE2 and TMPRSS2 were confirmed by qRT-PCR at each day of differentiation from hESCs. n = 9, biological repeat, values are mean and SD, One-way ANOVA, *p < 0.05, **p < 0.005, ***p < 0.0005, ****p < 0.0001, n.s.: non significance. (g) Validation of protein expression of ACE2 at each day of differentiation from hESCs. GAPDH was used as an internal control. (h) Schematic of SARS-CoV-2 infection strategy for hESC-derived peripheral neurons. (i) Tendency to increase the expression level of SARS-CoV-2 nsp14 and RdRp was validated by qRT-PCR in SARS-CoV-2-infected hESC-derived peripheral neurons. Black line is measured value and red line is trend. Nonlinear regression, S = slope, R2 = fitness, Pearson r, *p < 0.05. (j) Representative images of SARS-CoV-2 infection. Nucleoprotein of coronavirus (N) (red) was immuno-stained in wild type (upper panel) or ACE2 KO (lower panel) hESC-derived peripheral neurons. DAPI was stained as counter staining (blue). Scale bars correspond to 50 μm. (k) Number of SARS-CoV-2-infected neuron was counted from wild type or ACE2 KO neuros post 72 h of SARS-CoV-2 infection. n = 4, biological repeat, values are mean and SD. Unpaired t-test, ****p < 0.0001. (l) Expression level of viral genes, nsp14, RdRp, S and N were validated by qRT-PCR. n = 11, biological repeat, values are mean and SD. Paired t-test, ****p < 0.0001. (m) Venn diagram of the up-regulated genes (upper) or down-regulated genes (lower) in SARS-CoV-2-infected peripheral neurons of each group. Lists of 1,185 genes for up-regulated genes or 332 genes were shared in both experimental sets. (n) Network analysis using the STRING algorithm by uploading selected genes associating viral infection. Colours, categories and false discovery rate (FDR) are indicated. (o) Gene ontology results for biological process from up-regulated genes in SARS-CoV-2-infected neurons. Ontology terms were selected by p-value (FDR < 0.05). Analysed using PANTHER algorithm.