Figures & data
Figure 1. Suppression of GSK3 kinase activity by 6-BIO reactivates HIV-1 from CD4+ T cells. ACH2 cells were incubated with indicated concentrations of 6-BIO for 24 h, (A) the expressions of GSK3, β-catenin and TCF1 and their phosphorylated forms were detected by Western blotting with specific antibodies; (B) the nuclear translocation of β-catenin and TCF1 were detected by Western blotting; (C) HIV-1 reactivation was measured by quantifying the production of gag mRNA. (D–F) Assay for GSK3 inhibition, TCF1 expression, and HIV-1 reactivation. (G, H) 6-BIO inhibits GSK3 activity and reactivates HIV-1 in J-Lat cells. J-Lat 10.6 or J-Lat A2 cells were incubated with indicated concentrations of 6-BIO for 24 h, and the inhibition of GSK3 activity and the expressions of β-catenin and TCF1 were detected by Western blotting (G), and viral reactivation was detected by quantifying the GFP+ cells (H). Grey intensity of the Western blotting strips was analysed with software of Image J (A, B, D). Result is one representative from five independent repeats. Data are presented as mean ± SD. **P < 0.01, *** P < 0.001, and ****P < 0.0001 denote significant difference.
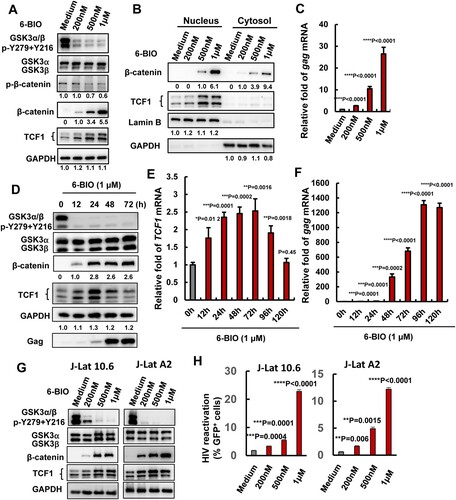
Figure 2. Inhibition of β-catenin/TCF1 axis attenuates 6-BIO-triggered HIV-1 reactivation. (A) The expression of TCF/LEF family members. ACH2 cells (1×10⁶) were treated with 6-BIO (1 μM) for 24 h, the expression of TCF1, TCF3, TCF4, and LEF1 was quantified by real-time qPCR and the relative enhancement fold was calculated. (B, C) Interference with the β-catenin/TCF1 pathway attenuates 6-BIO-induced viral reactivation. The endogenous GSK3α, GSK3β, β-catenin, or TCF1 was knocked-down with lentiviruses containing specific shRNAs for 48 h (B), and cells were further treated with 6-BIO (1 μM) for additional 24 h and viral reactivation was detected and calculated (C). Result is one representative from five independent repeats. Data are presented as mean ± SD. *** P < 0.001 denotes significant difference.
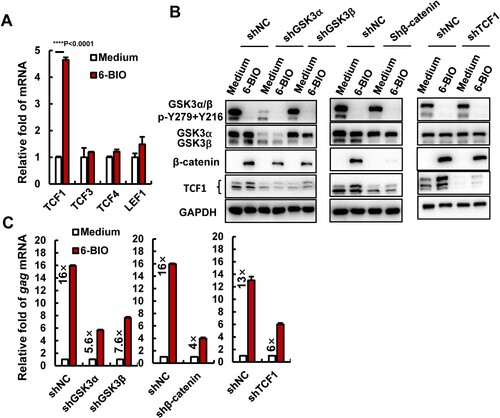
Figure 3. Transcriptome analysis reveals 6-BIO-mediated activation of T cells and cellular β-catenin/TCF1 signalling. ACH2 cells were treated with 6-BIO (1 μM) for 24 h, (A) Volcano plot of differentially expressed genes (DEGs) comparing 6-BIO-treated versus untreated (medium) cells. (B) Gene ontology (GO) functional enrichment analysis of DEGs. The colour bar indicates the minus logarithm of q values, and bubble size indicates the absolute gene counts enriched in a GO term. (C) GSEA showing the distribution of the gene sets that related to T cell activation and Wnt signalling pathway and the enrichment scores based on DEGs. (D) Transcription-factor enrichment analysis of DEGs. The colour bar indicates the minus logarithm of q values, and bubble size indicates the gene enrichment ratio regulated by a transcription factor. (E, F) Heatmaps showing relative expression level (left panel), fold change (middle panel), and adjusted p values (right panel) for gene sets related to T cells activation (E) and Wnt signalling (F).
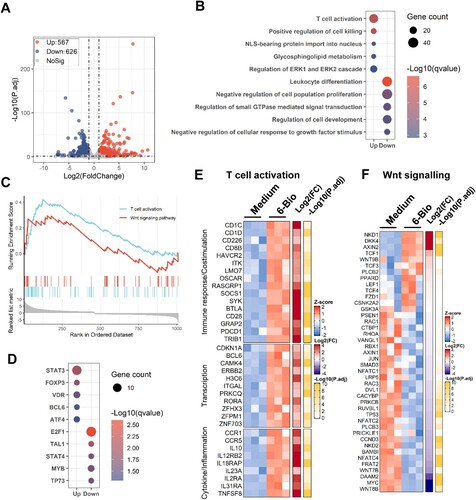
Figure 4. 6-BIO treatment enhances TCF1’s binding to 5′-LTR to promote HIV-1 transcription. (A) A schematic diagram of HIV-1 5′-LTR and the primers used for quantifying the initiation and elongation of HIV-1 transcription in the products of transcribed viral mRNAs. Pro, proximal; Int, intermediate; Dis, distal. ACH2 cells was treated with 6-BIO (1 μM) for 24 h, (B) cells were subjected to ChIP assay to detect TCF1 binding to HIV-1 5′-LTR, and fragments of HIV-1 5′-LTR nucleosomes (NUC0, NUC1, NUC2) and the DHS were amplified by PCR and the fold enrichment was calculated, or (C) transcribed viral mRNAs were isolated and specific primers were used to quantify the initiation and elongation of HIV-1 transcription. (D–F) 6-BIO treatment promotes HIV-1 infection of Jurkat T cells and viral transcription. Jurkat T cells (1×10⁶) were acutely infected with pseudotyped HIV-Luc/NL-3 (5 ng p24Gag) for 24 h in presence of indicated concentrations of 6-BIO. Viral infection was measured by quantifying the luciferase activity, the initiation and elongation of HIV-1 transcription were measured (sample from 1 μM 6-BIO) (D), and the GSK3 activity, the expressions of β-catenin and TCF1 and their nuclear tranlocation were detected by Western blotting (E, F). Result is one representative from four independent repeats. Data are presented as mean ± SD. **P <0.01, ***P <0.001 and ****P < 0.0001 denote significant difference.
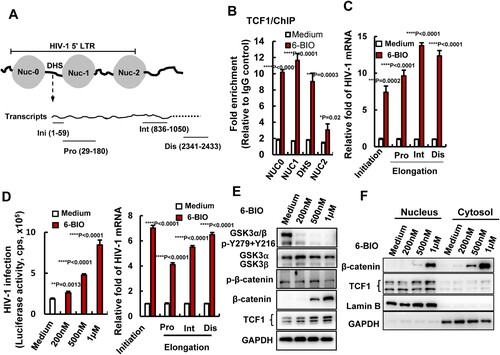
Figure 5. 6-BIO treatment alters histone epigenetic modification of HIV-1 5′-LTR. (A, B) TCF1 knockdown alters histones epigenetic modification of nucleosomes in HIV-1 5′-LTR. The endogenous TCF1 in ACH2 cells was knocked-down with lentiviruses containing specific shRNAs for 48 h (A), and the epigenetic modifications of active marks H3K27ac, H3K3me3 and repressive marks H3K9me3, H3K27me3 in nucleosomes of HIV-1 5′-LTR were analysed by ChIP assay (B). (C, D) 6-BIO treatments alter histones epigenetic modification of HIV-1 5′-LTR. ACH2 cells without TCF1 knockdown (C) or with TCF1 knockdown (D) were treated with 6-BIO (1 μM) for 24 h and cells were subjected to ChIP assay. Result is one representative from four independent repeats. Data are presented as mean ± SD. **P <0.01, ***P <0.001 and ****P < 0.0001 denote significant difference.
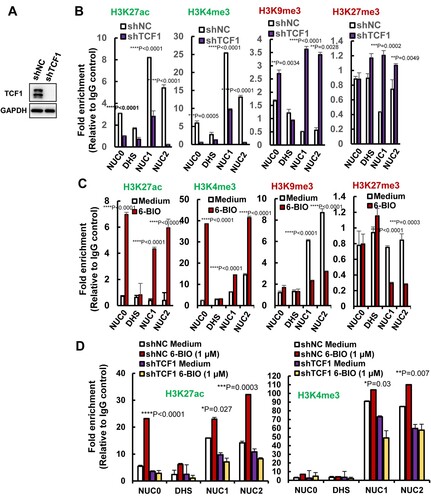
Figure 6. 6-BIO-triggered activation of β-catenin/TCF1 axis reactivates HIV-1 in PBMCs isolated from cART-suppressed patients. PBMCs (1×10⁷) isolated from cART-suppressed HIV-1 patients were treated with 6-BIO (1 μM) or PHA-P (5 μg/ml) for 5 days, viral reactivation was measured by quantifying the percentage of Env+ CD4+ T cells (A, B), or by quantifying the production of intracellular gag or tat-rev mRNAs, and the enrichment fold for viral reactivation relative to medium treatment was calculated (C). (D, E) 6-BIO promotes β-catenin nuclear translocation in PBMCs from cART-suppressed HIV-1 patients. The PBMCs from 2 representative donors were harvested for subjecting immunoblotting, to detect the total levels and protein expression and phosphorylation (E), and to determine nuclear and cytoplasmic levels of β-catenin and TCF1. *P <0.05 and ****P <0.001 denote significant difference.
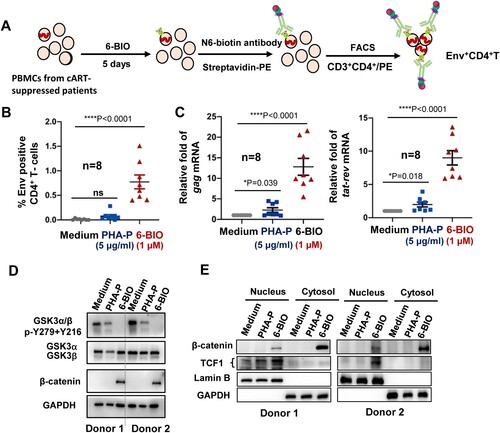
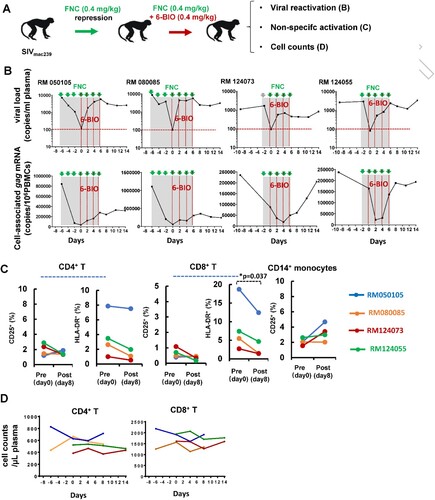
Figure 7. 6-BIO reverses SIV latency in rhesus macaques. Four Chinese rhesus macaques were challenged with 5000TCID50 amounts of SIVmac239 intravenously via saphenous vein, and animals then were treated with FNC (0.4 mg/kg), followed with intravenous infusions of 0.4 mg/kg 6-BIO every two days (A). (B) Viral reactivation was measured by defining the production of both plasma and cell-associated gag mRNAs. (C) Non-specific activation assay. PBMCs were isolated at the time point of pre- (day 0) and post- (day 8) treatment with 6-BIO, and cells were immunostaining and the surface expressions of CD25 and/or HLD-DR on the CD4+ T-lymphocytes, CD8+ T-lymphocytes, and CD14+ monocytes were analysed with flow cytometry. (D) The plasma cell numbers of CD4+- and CD8+-T-lymphocytes were longitudinally monitored using BD TruCount tubes. *P <0.05 denotes significant difference.