Figures & data
Figure 1. Obatoclax inhibits SARS-CoV-2 pseudoviral infections. (A) Schematic representation of the procedure of SARS-CoV-2 pseudoviral infection and obatoclax (Oba) treatment. (B–D) Human lung carcinoma cells Calu-3 or A549, as well as human colonic adenocarcinoma cells Caco-2, were pre-transfected with plasmid hACE2. At 72 h post transfection, Calu-3-hACE2, A549-hACE2, or Caco-2-hACE2 cells were pre-incubated with different concentrations of Oba (from 0.001 to 3.3 μM) or control DMSO for 2 h, followed by infection with SARS-CoV-2-S-pseudotyped viruses (7.6 × 10⁵ copies/mL) for 24 h. At 72 h post-pseudovirus inoculation, relative light units (RLUs) were detected using luciferase reporter assay and cell viability was measured using CCK-8 assay. These data were normalized to that of control DMSO. (E–G) Calu-3-hACE2, A549-hACE2, and Caco-2-hACE2 cells were pre-incubated with 0.2 μM Oba for 2 h and then infected with SARS-CoV-2-S-pseudotyped virusesas as (B–C). The fluorescent signal of viral spike expression was detected by confocal microscopy at 48 h post-virus infection. Scale bar: 10 μm; magnification: 630×. All these experiments were repeated at least three times.
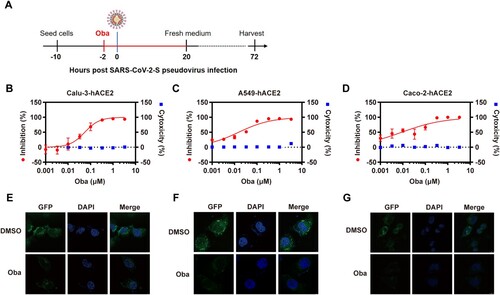
Figure 2. Obatoclax inhibits the infections with clinical SARS-CoV-2 isolates. (A) Schematic representation of the procedure of SARS-CoV-2 infection and obatoclax (Oba) treatment. (B-I) Calu-3 and Caco-2 cells were pre-treated with Oba at 0.33 μM, 1 μM, and 3.3 μM for 1.5 h and then infected with a clinical SARS-CoV-2 isolate wild-type strain B.1 (MOI = 0.1). At 2 h post-viral infection, the supernatant was removed and replaced by fresh culture medium containing the respective amount of Oba. At 24 h post-virus inoculation, supernatant aliquots were frozen and viral S and N proteins in the infected cells were quantified by in-cell-ELISA (B-E). Viral progeny of SARS-CoV-2 was quantified from culture supernatants by realtime RT-qPCR targeting S and E gene (F-I). All these experiments were repeated at least three times. *P < 0.05; **P < 0.01; ns, not significant.
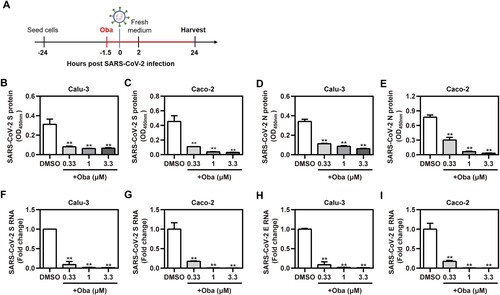
Figure 3. Obatoclax inhibits the endocytosis of SARS-CoV-2. Calu-3 (A) and A549 (B) cells were transfected with plasmid hACE2. At 72 h post transfection, Calu-3-hACE2 and A549-hACE2 cells were treated with 0.2 μM obatoclax (Oba) and 3 μM or 8 μM chlorpromazine for 2 h, followed by SARS-CoV-2-S-pseudotyped virus infection (7.6 × 10⁵ copies/mL) for 24 h. At 72 h post-pseudovirus inoculation, relative light units (RLUs) were detected using luciferase reporter assay and normalized to that of control DMSO. Calu-3-hACE2 (C) or A549-hACE2 (D) cells were treated with 0.2 μM Oba for 48 h. The levels of EEA1, CD63, and LAMP1 expression from cell lysates were detected by western blotting, using beta-actin as a loading control. The LAMP1 expression in Calu-3-hACE2 (E) and A549-hACE2 (F) cells were imaged by confocal microscopy. Calu-3-hACE2 (G) and A549-hACE2 (H) cells were treated with 0.2 μM Oba for 24 h, and stained using LysoTracker Red. Cells treated with Earle’s balanced salt solution (EBSS) and starved for 2 h were used as a positive control. The fluorescence intensity of LysoTracker Red was detected by confocal microscopy. Scale bar: 10 μm; magnification: 630×. All these experiments were repeated at least three times. * P < 0.05; ** P < 0.01; ns, not significant.
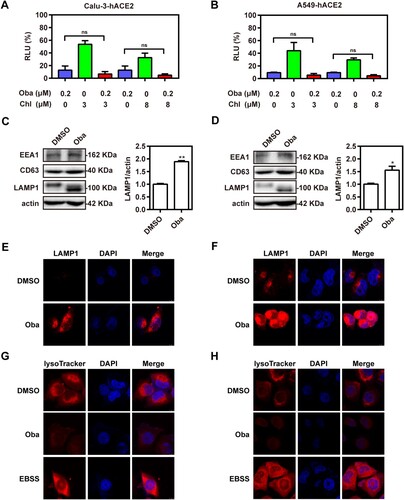
Figure 4. Obatoclax inhibits the activity of endosomal cysteine protease CTSL. Calu-3 and A549 cells were transfected with plasmid hACE2. At 72 h post transfection, Calu-3-hACE2 (A) and A549-hACE2 (B) cells were treated with 0.2 μM obatoclax (Oba) for 48 h. The levels of CTSB and CTSL expression from cell lysates were measured by western blotting, using beta-actin as a loading control. The ratios of mature CTSL: beta-actin were calculated by densitometry analysis. (C–F) Calu-3-hACE2 or A549-hACE2 cells were pre-treated with various concentrations of MDL28170 or CA074-Me from 0.01 μM to 10 μM or control DMSO for 2 h, followed by infection with SARS-CoV-2-S-pseudotyped viruses (7.6 × 10⁵ copies/mL) for 24 h. At 72 h post-pseudoviral inoculation, relative light units (RLUs) were detected using luciferase reporter assay and cell viability was measured using CCK-8 assay. These data were normalized to that of control DMSO. (G) Calu-3-hACE2 and (H) A549-hACE2 cells were pre-treated with 10 μM MDL28170, 10 μM CA074-Me, 10 μM E64d, or control DMSO for 2 h, followed by infection with SARS-CoV-2-S-pseudotyped viruses for 24 h. At 72 h post-pseudoviral inoculation, the fluorescence intensity of green fluorescence protein (GFP) was analysed by confocal microscopy. Scale bar: 10 μm; magnification: 630×. Calu-3-hACE2 (I) and A549-hACE2 (J) cells treated with 0.2 μM Oba and 2 μM or 10 μM MDL28170 for 72 h and infected with SARS-CoV-2-S-pseudotyped viruses as (C–F). RLUs were measured at 72 h post-pseudovirus inoculation. All experiments were repeated at least three times. * P < 0.05; ** P < 0.01; ns, not significant.
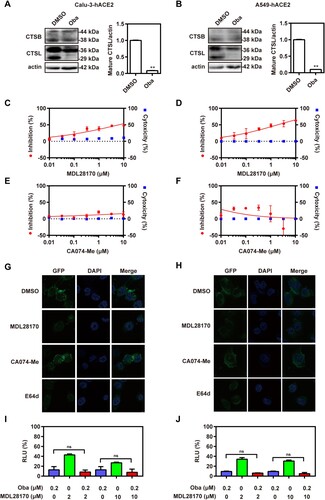
Figure 5. Obatoclax blocks the membrane fusion of SARS-CoV-2 by inhibiting protease furin activity. HEK293T cells as effector cells were transfected with plasmid pS-G614; Calu-3 (A) and A549 (B) cells were transfected with plasmid hACE2 as target cells. The cell–cell fusion rate was analysed by confocal microscopy in the presence of 0.2 μM Obatoclax (Oba) or DMSO. Scale bar: 10 μm; magnification: 200×. The fusion rate was set as 100% in a DMSO-treated group. Calu-3-hACE2 (C) and A549-hACE2 (D) cells were treated with 0.2 μM Oba or DMSO for 48 h. The levels of furin and TMPRSS2 from cell lysates were measured by western blotting, using beta-actin as a loading control. The furin /actin ratio was calculated by densitometry analysis. Calu-3-hACE2 (E) and A549-hACE2 (F) cells were treated with 0.2 μM Oba and 10 μM or 20 μM Decanoyl-RVKR-CMK (CMK). Calu-3 (G) and A549 (H) cells were co-transfected with plasmid hACE2 and TMPRSS2 or vector control pCMV3, and then treated with the indicated concentrations (0.033, 0.1, 0.33, and 1 μM) of Oba for 72 h. At 72 h post-SARS-CoV-2-S-pseudovirus inoculation (7.6 × 10⁵ copies/mL), relative light units (RLUs) were measured using luciferase reporter assay and normalized to that of control DMSO. All experiments were repeated at least three times. * P < 0.05; ** P < 0.01; ns, not significant.
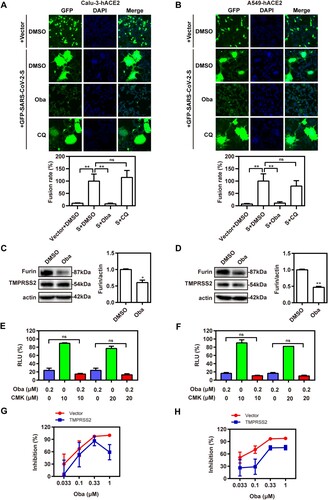
Figure 6. Obatoclax inhibits membrane fusion of SARS-CoV-2 by targeting MCL-1. (A) A549 cells were pre-transfected with plasmid hACE2. At 72 h post transfection, A549-hACE2 cells were treated with 0.2 μM obatoclax (Oba) and 10 μM or 20 μM TW-37 for 2 h, followed being infected with SARS-CoV-2-S-pseudotyped viruses (7.6 × 10⁵ copies/mL). (B) A549 cells were pre-transfected with plasmid hACE2 and specific siRNA against MCL-1 (siMCL-1) or siRNA negative control (siNC), then treated with 0.1 μM or 0.2 μM Oba for 72 h. At 72 h post-pseudovirus inoculation, relative light units (RLUs) were measured using luciferase reporter assay and normalized to that of control DMSO. (C) A549-hACE2 cells were treated with 10 μM TW-37 or control DMSO for 48 h and total protein was extracted for western blotting. (D) A549-hACE2 cells were transfected with 40 nM siMCL-1 or siNC for 48 h. The levels of furin and TMPRSS2 from cell lysates were measured by western blotting, and β-actin was used as a loading control. HEK293T cells as effector cells were transfected with plasmid pS-G614, and A549-hACE2 cells were used as target cells. (E) The effect of TW-37 on cell–cell fusion was imaged by confocal microscopy. (F) The effect of MCL-1 silencing on cell-cell fusion was imaged by confocal microscopy. Scale bar: 10 μm; magnification: 200×. (G) A549 cells were transfected with a plasmid MCL-1 expressing tag protein Flag or vector control pCMV-10. At 48 h post transfection, total protein was extracted for western blot. A549 cells were pre-transfected with plasmids hACE2 and a clone vector expressing MCL-1 with tag protein Flag or vector control pCMV-10. At 72 h post transfection, followed by treatment with 0.2 μM Oba or DMSO for 48 h. (H) The levels of furin and TMPRSS2 from cell lysates were measured by western blotting. (I) The effect of MCL-1 overexpression and Oba treatment on the cell-cell fusion was imaged by confocal microscopy. All the experiments were repeated independently at least three times. * P < 0.05; ** P < 0.01; ns, not significant.
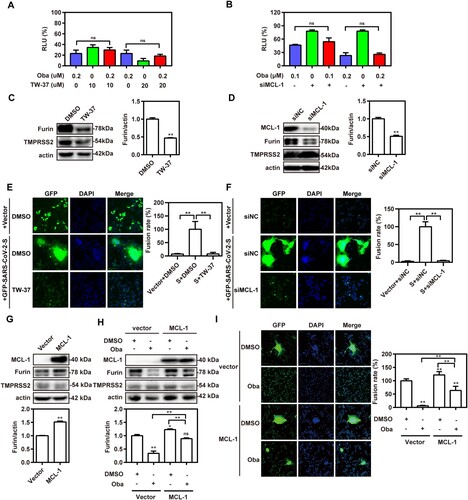
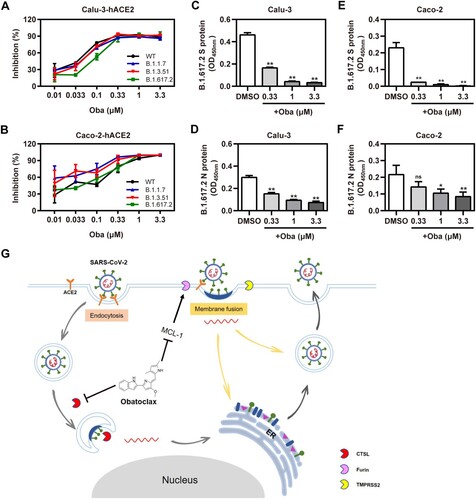
Figure 7. Obatoclax inhibits different mutant SARS-CoV-2 infections in vitro. Calu-3 and Caco-2 cells were pre-transfected with plasmid hACE2. At 72 h post transfection, Calu-3-hACE2 (A) and Caco-2-hACE2 (C) cells were treated with different concentrations (from 0.01 to 3.3 μM) of obatoclax (Oba) for 2 h, followed being infected with equivalent doses (7.6 × 10⁵ copies/mL) of each SARS-CoV-2-S-pseudotyped viruses, including wild-type (WT; B.1, GenBank: QHD43416), Alpha (B.1.1.7), Beta (B.1.351), and Delta (B.1.617.2) mutant spike pesudotyped viruses. Relative light units (RLUs) were measured using luciferase reporter assay and normalized to that of control DMSO. These experiments were repeated at least three times. (C–F) Calu-3 and Caco-2 cells were pre-treated with Oba at 0.33, 1 μM, and 3.3 μM for 1.5 h and then infected with a clinical SARS-CoV-2 isolate variant Delta (B.1.617.2) (MOI = 0.1). At 2 h post-infection, the supernatant was removed and replaced by fresh culture medium containing the respective amount of obatoclax. At 24 h post-virus inoculation, viral S (C,D) and N (E,F) proteins in the infected cells were quantified by in-cell-ELISA. These experiments were repeated at least once. (G) Proposed model of Oba inhibition of SARS-CoV-2 infection by blocking endocytosis through inhibiting endosomal cysteine protease CTSL activity and SARS-CoV-2-S-mediated membrane fusion of viral entry through inhibiting furin protease activity by targeting MCL-1.