
Figures & data
Table 1. Identification of ticks deemedTable Footnotea to be acquired within Alberta submitted from 2000 to 2018.
Figure 1. Number of ticks submitted over time and proportional representation of genera in teach time category (n = 2,326 ticks). Data values in bold font represent proportions in the specific year(s) indicated. Data values that are not bolded represent numbers of ticks submitted in the year(s) indicated.
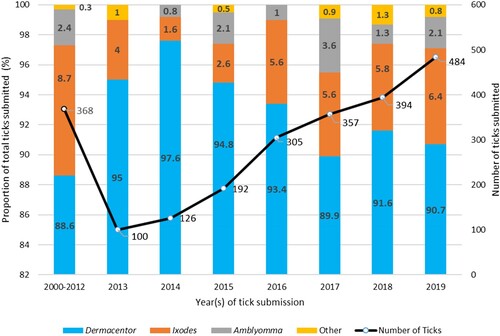
Figure 2. Numbers of each tick genera submitted from each Alberta health region based from 2013 to 2019: (a) North Zone; (b) Edmonton Zone; (c) Central Zone; (d) Calgary Zone; (e) South Zone; (f) Map of Alberta showing health zones. a Figure adapted from Can Resp J 2016; 1382434:1–9.
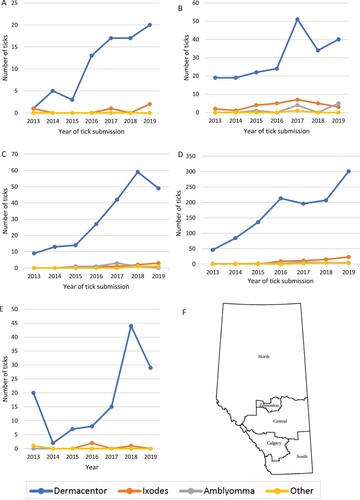
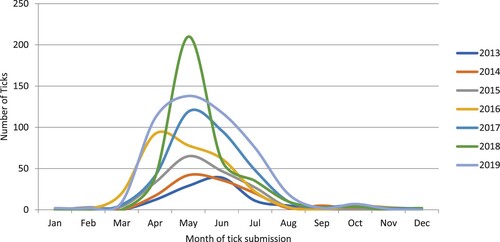
Figure 3. Seasonality of Alberta-acquired ticks submitted for identification from 2013 to 2018 (n = 1,876). Abbreviations: Jan – January; Feb – February; Mar – March; Apr – April; Jun – June; Jul – July; Aug – August; Sep – September; Oct – October; Nov – November; Dec – December.
Supplemental Material
Download MS Word (18.4 KB)Data availability
The datasets used and/or analysed during the current study are available from the corresponding author on reasonable request.