Figures & data
Figure 1. Plasma-neutralizing activity. (A) Schematic illustration of the study design. Two-dose inactivated vaccine was injected on days 0 and 21. The longitudinal samples were collected for serological tests and IgH repertoire sequencing. (B) Surrogate virus-neutralizing test (sVNT) was performed to measure the plasma-neutralizing activity using an ACE2-competition assay. An interval plot shows a 95% confidence interval for the mean of each group at different time points. P values were calculated from a paired two-tailed Student’s t-test. ***p < 0.001, **p < 0.01. N.D.: not detectable. A dashed line indicates the assay detecting threshold. Participants were arbitrarily divided into the Hi (upper quartile, pink), Me (the interquartile range, orange) and Lo (lower quartile, purple) groups based on the sVNT titres on day 35. (C) Plasma-neutralizing activity was measured with pseudotyped virus expressing SARS-CoV-2 spike (Wuhan-Hu-1) on days 28 and 35. The dot represents the activity in each participant. Hi and Lo groups are depicted as these in (B). (D) Neutralizing activity against pseudotyped viruses expressing indicated original and variant S proteins of samples collected on day 35.
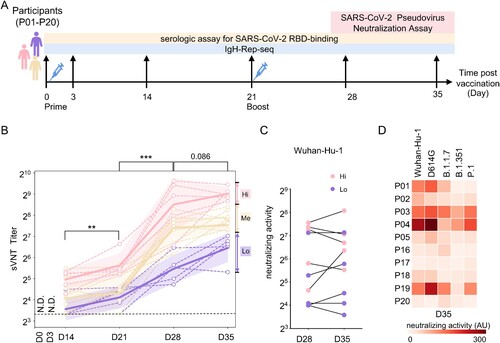
Figure 2. Antibody clonotype diversity analysis. (A) The observed IgH V3J clonotypes in sVNT groups are shown as box plots. Different sVNT groups are depicted in (B). Unpaired two-tailed student’s t-test reveals statistical differences between “Hi” and “Lo” samples on day 3 and between days 0 and 3 in “Lo” group samples. *p < 0.05. (B) The missing IgH V3J clonotypes in the indicated sVNT groups (“Hi” and “Lo”) are plotted as interval plots with a 95% confidence interval for the mean. Chao 1 and Recon are used to estimate the number of unobserved (missing) V3J clonotypes. Dots indicate numbers from each individual.
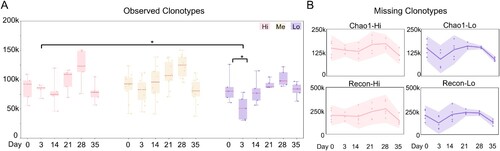
Figure 3. Landscape view of antibody IgH repertoire upon along vaccination. The V gene segment usages at different timepoints are plotted as circos plots. In the outside bargraph, V-usage of each sample are shown by three sVNT groups, and the dot represents the number in each participant. V gene segments are grouped into 7 indicated families and plotted below the bar graph with different colours. V gene segments used by reported SARS-CoV-2 neutralizing-antibodies (nAb) are labelled with yellow triangles. Differential V gene segment usages between the sVNT “Hi” and “Lo” groups were calculated by applying an unpaired two-tailed student’s t-test. The p values are plotted as heatmaps in the inner circle. More V-usage in the sVNT “Hi” group is marked in red, and less V-usage in the sVNT “Hi” group is marked in blue.
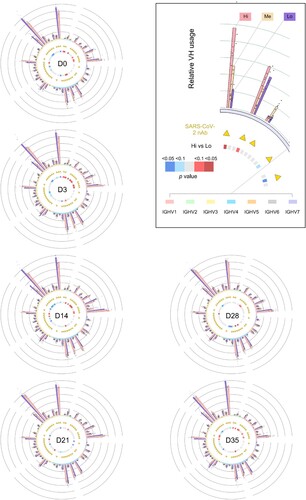
Figure 4. Intrinsic features associated with antibody response. (A) Differential V-usage along the vaccination process of pooled samples. The V gene segments are arranged along the Y-axis based on its usage frequency on day 0 (left). For each V gene segment, usage frequencies were compared between the indicated timepoints and day 0. P values were calculated from an unpaired two-tailed student’s t-test and plotted as a heatmap. Compared with Day 0, a few underrepresented V genes (VH3-38, VH3-64D, VH2-26, VH2-70, VH4-61, VH1-58, VH4-28; < 0.5% in IgH repertoire at Day 0) were significantly increased on Day 21 or 28. (B) Differential V-usage between sVNT Hi and Low groups (left, five samples in each group), or between two sVNT groups in the interquartile range (right, five samples in each group). The top and bottom 10 represented V gene segments are shown separately. The V gene segments are arranged along the Y-axis by the p values calculated with an unpaired two-tailed student’s t-test. The V gene segments are arranged along the Y-axis with its usage frequency on day 0 (left). The V gene segment usage frequency on day 0 is also shown. Indicated scales are shown at the bottom of Panel B and C. Individual V gene segment names are listed in Supplementary Table 3. (D) The dynamic changes of IgG1 frequency along the vaccination process in different sVNT groups are shown as interval plots with a 95% confidence interval for the mean of each group. Dots indicate numbers from each individual.
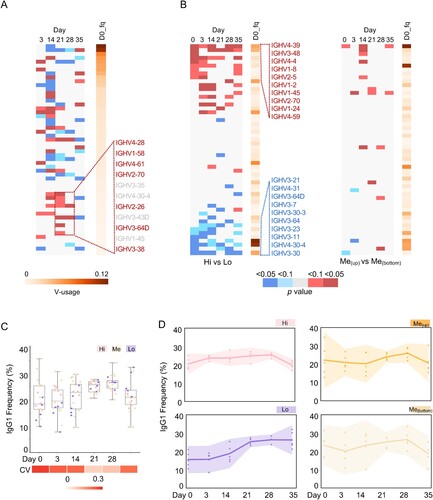
Figure 5. Convergent antibody response among the vaccinated individuals. (A) Schematic illustration of the procedure to identify common antibody clonotypes. The antibody clonotypes were identified from the raw data and clustered by allowing 2 amino acid mismatches at CDR3. For each cluster, convergent response was determined by the co-occurrence of a particular clonotype cluster in difference individuals. Clonotype clusters shared by at least 4 individuals (threshold) were subjected to downstream analysis. The convergent index is defined as the percentage of common clonotype clusters in the total IgH repertoire. (B) The identified common clonotype cluster numbers when the different thresholds were applied. Samples from each timepoint are plotted with indicated colours. (C) The fraction of common and unique clonotypes in the total IgH repertoire, when the threshold is set as “4”. Each dot represents a number from each individual. (D) The IgH repertoire convergent index of each participant (P01-P20) along the different timepoint is shown as a heatmap (upper). A combined convergent index is shown as an interval plot (bottom) with the mean and 95% confidence interval. Dots indicate numbers from each individual.
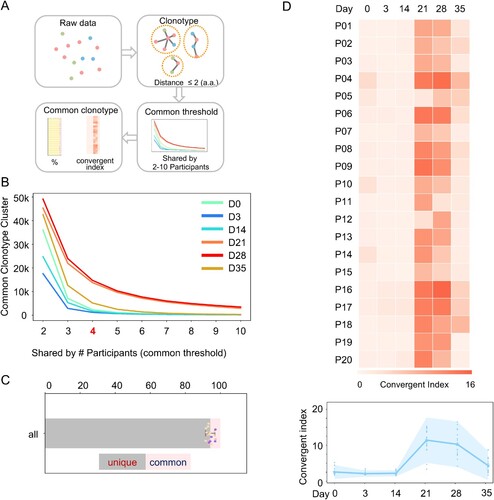
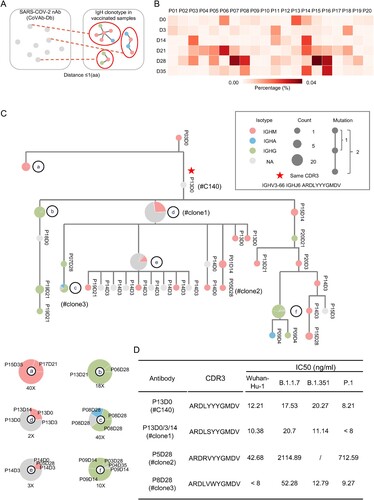
Figure 6. SARS-CoV-2 nAb clonotypes in vaccinated individuals. (A) Schematic illustration of the procedure to identify known SARS-CoV-2 nAb clonotype in the IgH repertoires of vaccinated individuals. SARS-CoV-2 nAbs were retrieved from the CoVAb-Database. The SARS-CoV-2 nAb clonotypes were identified by allowing 1 amino acid mismatches at CDR3. (B) The frequency of SARS-CoV-2 nAb clonotype in the individual at the indicated timepoint is plotted as a heatmap. Scale is shown at the bottom. (C) A representative SARS-CoV-2 nAb clonotype phylogenetic tree is shown. The longitudinal distance indicates the absolute Hamming Distance of the CDR3 amino acid sequence between each node. Of each node, antibody class is indicated by colour, and the node size corresponds to the sequence counts. The clonotype with identical CDR3 sequence with the published SARS-CoV-2 nAb is marked with a star, and its CDR3 sequence is listed. For nodes with different antibody classes, an enlarged panel is shown at the bottom with an indicated magnitude. The sequence is named by participant number and timepoint, e.g. P13D0 indicates a sequence found in the repertoire of participant #13 on day 0. (D) Four antibodies were picked from the clonal cluster shown in Panel C. Recombination antibody protein was purified and tested in the pseudotyped virus-based neutralization assay.