
Figures & data
Figure 1. Generation and characterization of a hybrid replicon VEEV-SARS-CoV-2-S. (A) Schematic representation of the genomic organization of VEEV-SARS-CoV-2-S in which the structural protein sequences were replaced by the gene of SARS-CoV-2 S protein. (B) IFA analysis of the expression of S protein in VEEV-SARS-CoV-2-S RNA-transfected Vero-E6 cells using RBD monoclonal antibody at the indicated times post-transfection. The expression of GFP in the control replicon RNA (VEEV-eGFP)-transfected Vero-E6 cells was also measured. The length of the scale bar (displayed in a white line segment) represents 20 μm. (C) Schematic illustration of VEEV-SARS-CoV-2-S cell passage and supernatant passage. The VEEV-eGFP replicon was used as a negative control that underwent the same procedure. (D) IFA analysis of the expression of S protein in VEEV-SARS-CoV-2-S replicating Vero-E6 cells at different passages using RBD monoclonal antibody. The expression of GFP in VEEV-eGFP passaged cells was used as a control. The length of the scale bar (displayed in a white line segment) represents 50 μm. Two independent experiments were performed and the cells analyzed from one or three fields of view in one coverslip of one experiment are presented. (E) RT-PCR analysis of the stability of S and nsP1-nsP2 genes during passage. The same analysis for VEEV-eGFP was used as a control.
Figure 2. Generation and characterization of VEEV-SARS-CoV-2-S-eGFP reporter system. (A) Schematic diagram of the VEEV-SARS-CoV-2-S-eGFP genome. The expression of an enhanced green fluorescent protein (eGFP) was driven by a second SG promoter in the VEEV-SARS-CoV-2-S genome. (B) Detection of GFP expression and syncytium formation under a fluorescent microscope in VEEV-SARS-CoV-2-S-eGFP RNA transfected Vero-E6 cells at 48 hpt. The magnified fields of view (I and II) were shown at the right two panels. The length of the scale bar (displayed in a white line segment) represents 50 μm. (C) Detection of GFP expression and syncytium formation in VEEV-SARS-CoV-2-S-eGFP replicating cells at each passage under a fluorescent microscope. The length of the scale bar (displayed in a white line segment) represents 50 μm. (D) RT-PCR analysis of the stability of S and nsP1-nsP2 genes during passage. (E) Viral quantification of the supernatant and cell RNA extracted from the P20 VEEV-SARS-CoV-2-S-eGFP. Viral RNA loads in P20 VEEV-SARS-CoV-2-S-eGFP supernatants and cells were determined by a real-time reverse transcription (RT)-PCR assay. The Vero-E6 supernatants and cells were used as a negative control. Two independent experiments were performed in duplicate. Data represent the mean ± standard deviation of duplicate measurements in a representative experiment. Statistical analysis was performed with unpaired t-test and the asterisks denote statistical differences between the indicated groups. **p < 0.01.
Figure 3. Cell-cell fusion and syncytium formation induced by VEEV-SARS-CoV-2-S-eGFP require S protein in an acidic environment. (A) Detection of GFP expression and syncytium formation in VEEV-SARS-CoV-2-S-eGFP cells in the presence of NH4Cl. 1 × 10⁵ VEEV-SARS-CoV-2-S-eGFP cells and 2 × 10⁵ naïve Vero-E6 cells were co-seeded per well in a 12-well plate in the presence of different concentrations of NH4Cl. The VEEV-eGFP replicon transfected Vero-E6 cells with the same treatment were used to rule out pleiotropic effects. The GFP expression and syncytium formation were detected under a fluorescent microscope at 18 h post incubation. The length of the scale bar (displayed in a white line segment) represents 50 μm. (B) Detection of GFP expression and syncytium formation in VEEV-SARS-CoV-2-S-eGFP cells in the presence of different compounds. 1 × 10⁵ VEEV-SARS-CoV-2-S-eGFP cells and 2 × 10⁵ naïve Vero-E6 cells were co-seeded per well in a 12-well plate in the presence of 10 μM of cepharanthine and remdesivir, respectively. The VEEV-eGFP replicon transfected Vero-E6 cells with the same treatment were used to rule out pleiotropic effects. The GFP expression and syncytium formation were detected under a fluorescent microscope at 18 h post incubation. The cells without treatment were used as a negative control. The length of the scale bar (displayed in a white line segment) represents 50 μm. Two independent experiments were performed, and one representative experiment is presented.
Figure 4. Cell-cell fusion and syncytium formation induced by VEEV-SARS-CoV-2-S-eGFP is hACE2-dependent. (A) GFP detection of the VEEV-SARS-CoV-2-S-eGFP transfected naïve BHK-21 cells or BHK-21 cells pre-transfected with hACE2 cDNA. BHK-21 cells were transfected with pCAGGS-hACE2 plasmid by the FuGENE® HD Transfection Reagent one day before the transfection of VEEV-SARS-CoV-2-S-eGFP RNA. The cell-cell fusion was presented by the expression of GFP at 48 and 72 hpt under a fluorescent microscope. The VEEV-eGFP transfected naïve BHK-21 cells or BHK-21 cells pre-transfected with hACE2 cDNA were used as a negative control. The length of the scale bar (displayed in a white line segment) represents 50 μm. Two independent experiments were performed and 3 fields in one representative experiment are presented. (B) Quantification of GFP fluorescence intensity. The integrated fluorescence intensity in panel A was quantified by ImageJ software. Data represent the mean ± standard deviation of 3 fields in the representative experiment. Statistical analysis was performed with two-way ANOVA and the asterisks denote statistical differences between the indicated groups. *p < 0.05; ****p < 0.0001. (C) Detection of GFP expression and syncytium formation in VEEV-SARS-CoV-2-S-eGFP cells in the presence of anti-human ACE2 antibody (hACE2 Ab). 1 × 10⁵ VEEV-SARS-CoV-2-S-eGFP cells and 2 × 10⁵ naïve Vero-E6 cells were co-seeded per well in a 12-well plate in the presence of 10 μg/ml of hACE2 Ab, and imaged by a fluorescent microscope at 18 h post incubation. The cells without treatment were used as a control. The length of the scale bar (displayed in a white line segment) represents 50 μm. Two independent experiments were performed in duplicate, and one representative experiment is presented. (D) Calculation of GFP fluorescence intensity. At 18 h post treatment, the aggregate fluorescence intensity in 169 fields of view (cover almost the whole well) per well in a 12-well plate with or without hACE2 Ab was read by a PerkinElmer high content screening system and represented by the relative infection ratio (defining no-antibody treatment as 100%). Data represent the mean ± standard deviation of duplicate measurements in a representative experiment. Statistical analysis was performed with unpaired t-test and the asterisks denote statistical differences between the indicated groups. ***p < 0.001.
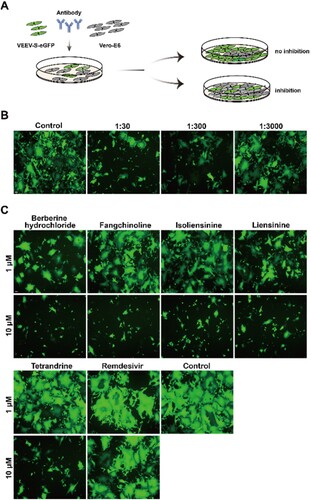
Figure 5. Validation of VEEV-SARS-CoV-2-S-eGFP system for assessing the anti-syncytium-formation activity of antiviral agents. (A) Schematic diagram of the neutralization assay. 1 × 10⁵ VEEV-SARS-CoV-2-S-eGFP cells and 2 × 10⁵ naïve Vero-E6 cells were co-seeded per well in a 12-well plate in the presence of mouse antisera, the GFP expression was detected under a fluorescent microscope at 18 h post incubation. Serum from mock-infected mice was used as a control. (B) Measurement of antiserum neutralizing activities. The length of the scale bar (displayed in a white line segment) represents 50 μm. (C) Measurement of anti-syncytium-formation activity of entry inhibitors. 1 × 10⁵ VEEV-SARS-CoV-2-S-eGFP cells and 2 × 10⁵ naïve Vero-E6 cells were co-seeded per well in a 12-well plate in the presence of 1 μM or 10 μM of inhibitors, and imaged by a fluorescent microscope at 18 h post incubation. The cells without treatment were used as a control. The length of the scale bar (displayed in a white line segment) represents 50 μm. Two independent experiments were performed in duplicate, and one representative experiment is presented.
Data availability
All data to understand and assess the conclusions of this study are available in this published article. The raw data that support the findings of this study are available from the corresponding author upon reasonable request.