Figures & data
Figure 1. Identification of the representative circRNA-cognate mRNA pairs perturbed in MERS-CoV infection. The expression kinetics of the representative circRNA–cognate mRNA pairs perturbed in MERS-CoV infection. The selected circRNA–mRNA pairs were significantly upregulated during MERS-CoV infection (fold change ≥2 and adjust P value <0.05) and positively co-expressed (Pearson correlation coefficient >0.7, correlation P values <0.05). Heatmaps were separately drawn based on the expression intensity of each circRNA (left panel) or mRNA (right panel) at different time points. Circles between the two heatmap represented the correlation between each circRNA and its cognate mRNAs. Deeper colour density indicated stronger positive correlations. The circle border width was mapped according to the correlation P value.
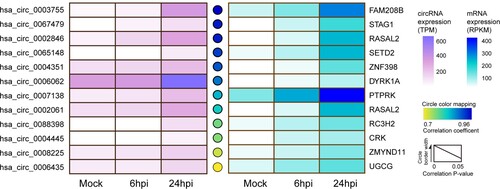
Figure 2. In silico analysis identifies splicing factors potentially regulating the generation of MERS-CoV-perturbed circRNA-mRNA pairs. (A) Heatmap presentation of MERS-CoV-perturbed differentially expressed (DE) splicing factors. The splicing factors were under hierarchical clustering and coloured by its normalized intensity scale [log2 (expression values in transcripts per million)]. (B) Candidate splicing factors potentially governing the expression of the representative circRNA-cognate mRNA pairs perturbed in MERS-CoV infection. The predicted binding motifs between each circRNA and splicing factor, Pearson correlation coefficients between each circRNA and splicing factor (PCC_circ) with its corresponding correlation P value (cP_circ), and Pearson correlation coefficients between each mRNA and splicing factor (PCC_m) with its corresponding correlation P value (cP_m) were listed. (C) Network demonstrating the interactions among MERS-CoV-perturbed circRNAs and splicing factors. Splicing factors and circRNAs were represented by rectangular and circular nodes, respectively. The general expression trend of each splicing factor during MERS-CoV infection was distinguished by filling colour (orange: up-regulated; blue: down-regulated). The size of splicing factors was proportional to the number of circRNAs potentially under their regulation. Among the seven splicing factors, HNRNPC and U2AF2 stood out to be the largest ones as they were predicted to regulate the highest number of circRNAs (10 circRNAs) over other candidate splicing factors. The filling colour density of each circRNA was mapped according to the number of its potential interactive splicing factors. Edge colour and thickness were proportionally correlated with the correlation coefficiency and correlation P value between each circRNA and splicing factor, respectively.
![Figure 2. In silico analysis identifies splicing factors potentially regulating the generation of MERS-CoV-perturbed circRNA-mRNA pairs. (A) Heatmap presentation of MERS-CoV-perturbed differentially expressed (DE) splicing factors. The splicing factors were under hierarchical clustering and coloured by its normalized intensity scale [log2 (expression values in transcripts per million)]. (B) Candidate splicing factors potentially governing the expression of the representative circRNA-cognate mRNA pairs perturbed in MERS-CoV infection. The predicted binding motifs between each circRNA and splicing factor, Pearson correlation coefficients between each circRNA and splicing factor (PCC_circ) with its corresponding correlation P value (cP_circ), and Pearson correlation coefficients between each mRNA and splicing factor (PCC_m) with its corresponding correlation P value (cP_m) were listed. (C) Network demonstrating the interactions among MERS-CoV-perturbed circRNAs and splicing factors. Splicing factors and circRNAs were represented by rectangular and circular nodes, respectively. The general expression trend of each splicing factor during MERS-CoV infection was distinguished by filling colour (orange: up-regulated; blue: down-regulated). The size of splicing factors was proportional to the number of circRNAs potentially under their regulation. Among the seven splicing factors, HNRNPC and U2AF2 stood out to be the largest ones as they were predicted to regulate the highest number of circRNAs (10 circRNAs) over other candidate splicing factors. The filling colour density of each circRNA was mapped according to the number of its potential interactive splicing factors. Edge colour and thickness were proportionally correlated with the correlation coefficiency and correlation P value between each circRNA and splicing factor, respectively.](/cms/asset/a6ddc30c-aef5-46a4-a0ee-371e7b9a2f53/temi_a_2032372_f0002_oc.jpg)
Figure 3. hnRNP C regulates the expression of MERS-CoV-perturbed circRNA and cognate mRNAs via direct binding. (A) Representative Western blot examining hnRNP C protein in input and immunoprecipitation (IP) samples for RNA immunoprecipitation (RIP) assay. Isotype antibody was used as a negative control to assess the binding specificity between hnRNP C and each circRNA. IB: immunoblotted. IgH: IgG heavy chain. (B) Representative gel electrophoresis validation of circRNAs immunoprecipitated using anti-hnRNP C and isotype-matched IgG antibody in Calu-3 cells with or without MERS-CoV infection. The red arrowheads indicated the immunoprecipitated circRNA. (C) The relative amount of circRNAs enriched from RIP. The quantification was made from the RT-qPCR results and by normalizing the expression values of circRNAs in IP samples with the expression values in input control samples. (D) Western blot demonstrated the efficient knockdown of hnRNP C in Calu-3 cells. (E, F) Expression changes of representative circRNAs (E) and cognate mRNAs (F) upon hnRNP C knockdown. Data from (C) represented mean ± standard deviation, n = 3. *P-value < 0.05; **P-value < 0.01; ***P-value < 0.001, one-way ANOVA. Data from (E) and (F) represented mean ± standard deviation, n = 3. *P-value < 0.05; **P-value < 0.01; ***P-value < 0.001, two-way ANOVA. Abbreviation: ns, not significant.
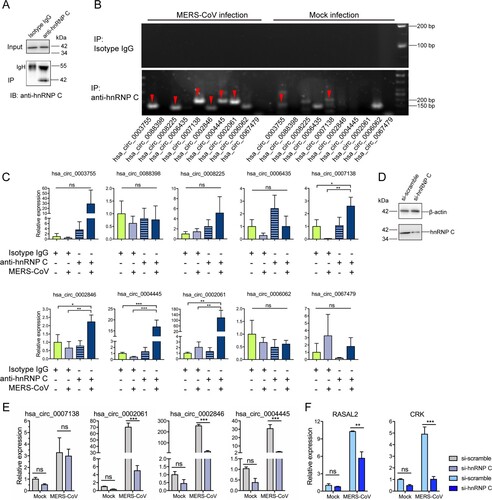
Figure 4. Depletion of hnRNP C and its target circRNAs restrict MERS-CoV propagation. (A) RT-qPCR examining the knockdown effect of siRNA candidates targeting hsa_circ_0002846, hsa_circ_0002061 and hsa_circ_0004445, respectively. Expression of GAPDH was used to normalize the quantification results. (B) Viral load detection of cells transfected with scramble control siRNAs, siRNAs targeting hsa_circ_0002846, hsa_circ_0002061 and hsa_circ_0004445, respectively at 24 hours post MERS-CoV infection (MOI = 0.1). (C) Multi-cycle MERS-CoV growth assay in the presence or absence of hnRNP C siRNA in Calu-3 cells. After inoculated with MERS-CoV (MOI = 0.1), culture supernatant and cell lysate were harvested at 2, 24, and 48 hpi to determine the viral load with RT-qPCR. Area under the curve analysis was conducted to reveal the total amount of viral genome copy increase over 2–48 hours period. Statistical significance was determined with Student's test. *P-value < 0.05; **P-value < 0.01; ***P-value < 0.001. (D) Flow cytometry examining MERS-CoV-NP-positive cells with or without hnRNP C depletion. Representative expression of endogenous hnRNP C and MERS-CoV-NP were plotted in left panel. Triplicated experiments were conducted for the quantification of the MERS-CoV-NP positive rate. (E) Multi-cycle MERS-CoV growth assay in the presence or absence of hnRNP C siRNA in primary human small airway epithelial cells (HSAECs). Culture supernatant and cell lysate were harvested at 2, 24, and 48 hours post MERS-CoV infection (MOI = 0.1) and subjected to RNA extraction and RT-qPCR measurement. Area under the curve analysis was conducted same as described above. All data represented mean ± standard deviation, n = 3. Statistical significance analyses for (A), (B), (D), and (E) were determined with one-way ANOVA. *P-value < 0.05; **P-value < 0.01; ***P-value < 0.001.
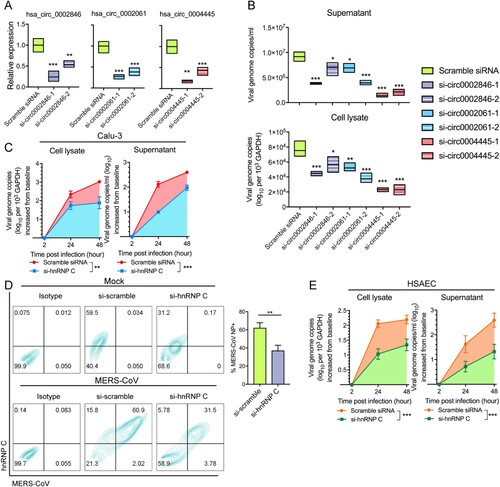
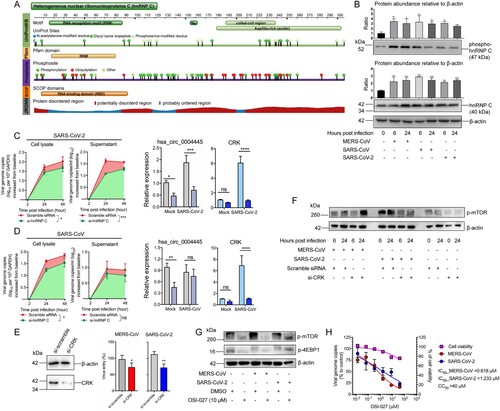
Figure 5. The modulation of hnRNP C in human-pathogenic coronavirus infections. (A) Demonstration of the representative structural features of hnRNP C by UniProtKB, Pfam, Phohsphosite, SCOP, and JRONN database. Protein feature view was adopted from the Protein Data Bank (PDB; http://www.rcsb.org/pdb/). (B) hnRNP C was upregulated and underwent phosphorylation modification upon MERS-CoV, SARS-CoV, and SARS-CoV-2 infection. The expression intensities of hnRNP C and phosphorylated hnRNP C in each sample were quantified in western blot images by ImageJ. (C) hnRNP C knockdown suppressed SARS-CoV-2 genomic copies intracellularly and extracellularly, and reduced the expression of hsa_circ_0004445 and CRK. (D) hnRNP C knockdown suppressed SARS-CoV genomic copies intracellularly and reduced the expression of CRK. Scramble siRNA-transfected cells were served as negative controls. Area under the curve analysis was conducted in the same way as described above. (E) Ablation of CRK restricted MERS-CoV and SARS-CoV-2 entry. After performing siRNA-mediated gene silencing for CRK for consecutive two days, Calu-3 cells were challenged with MERS-CoV or SARS-CoV-2 at 3.0 MOI respectively. Samples were harvested at 4 hpi to examine the viral loads. (F) Expression changes of phosphorylated mTOR (p-mTOR) upon hnRNP C knockdown in MERS-CoV-, SARS-CoV-2-, and mock-infected groups, respectively. (G) Expression of p-mTOR and phosphorylated 4EBP1 (p-4EBP1) decreased upon OSI-027 treatment. (H) Calu-3 cells were infected with MERS-CoV or SARS-CoV-2 and treated with various concentrations of OSI-027 (40, 8, 1.6, 0.32, 0.064, 0.0128 μM, and mock-treated). The IC50 for each virus was calculated based on viral load changes at 24 hpi. CC50 was determined in the absence of virus infection at 24 hour post drug treatment. Data represented mean ± standard deviation, n = 3. one-way ANOVA, *P-value < 0.05; **P-value < 0.01; ***P-value < 0.001.