Figures & data
Figure 1. The geographical distribution of 565 MRSA clinical isolates in this study. The circle size represents the number of isolates, and circle partitions represent the prevalence of different CCs of MRSA recovered from separate locations. The prevalence rate of MRSA for each location was adopted from the China Antimicrobial Resistance Surveillance Report (http://www.carss.cn/Report).
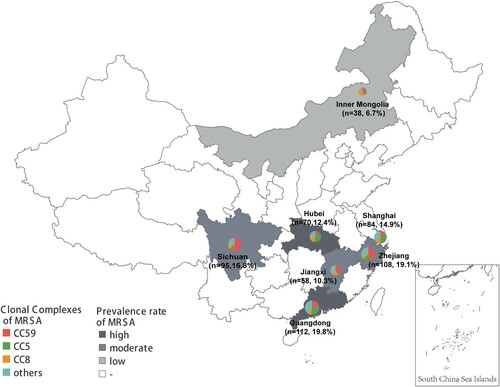
Figure 2. Antimicrobial susceptibility of MRSA strains. FOX, cefoxitin; OXA, oxacillin; ERY, erythromycin; CLI, clindamycin; CIP, ciprofloxacin; TET, tetracycline; GEN, gentamicin; FA, fusidic acid; MOP, mupirocin; RIF, rifampicin; SXT, sulfamethoxazole/trimethoprim; QD, quinupristin-dalfopristin; CPT, ceftaroline; DAP, daptomycin; TCL, teicoplanin; LNZ, linezolid; VAN, vancomycin; DAL, dalbavancin.
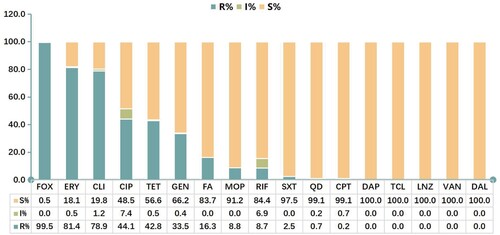
Figure 3. Minimal spanning tree based on the multi-locus sequence types of MRSA strains. All 28 STs are represented by a circle with colour. The size of each circle indicates the number of isolates of specific types. The shaded halo surrounding the STs encompasses related STs that belong to the same CC. These non-typable isolates were not included in this analysis.
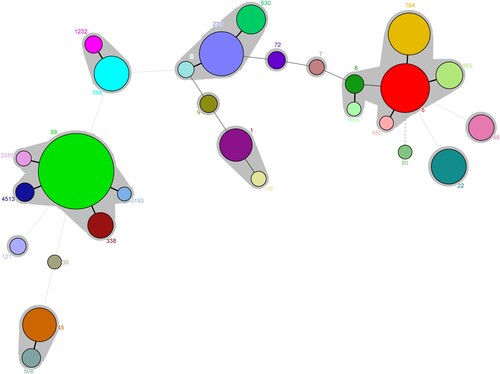
Figure 4. Antimicrobial susceptibility profiles among different CCs of MRSA isolates. (A) Resistance rates to various antimicrobials. These antimicrobials with <1.0% overall resistance rate were not included in this analysis. (B) Methicillin MIC distribution. The ≥8 MIC of methicillin was defined as methicillin resistance. (C) The resistome analysis. Only resistance determinants found in more than 10 isolates and carried by CC59, CC5, or CC8 are specifically displayed. For more details, see Table S2.
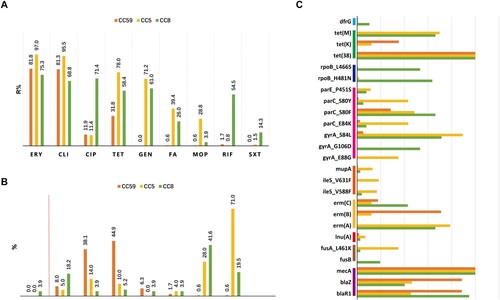
Figure 5. Major CCs found in MRSA isolates by years. (A) The distribution of four CCs over time. (B) The clonal structure of CC59, CC5 and CC8 in different years.
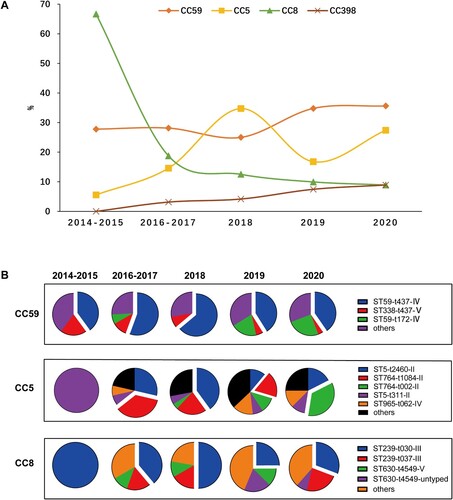
Figure 6. Core genome phylogenies for ST59 (A), ST5 (B), ST239(C), ST398, and ST764 (E). Phylogenetic trees were based on 88.4–89.8% core genome and 11844–47901 SNPs. The geographical origin of MRSA isolates in this study (circle symbol) is indicated with colours. Phylogenetic clades are indicated by the colours of branches.
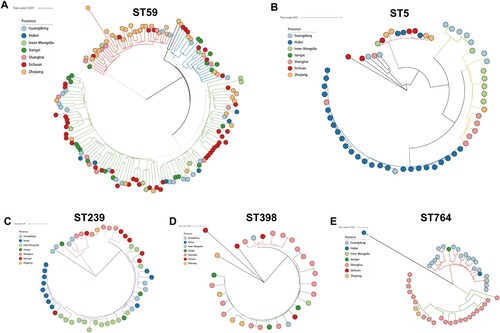
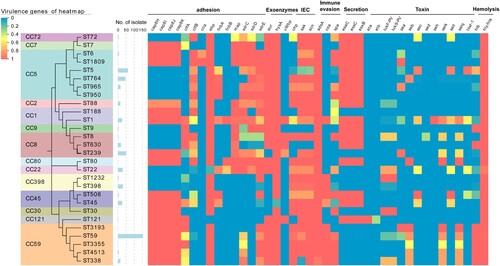
Figure 7. Heatmap illustrating virulence genotype of different STs (CCs). The evolutionary tree based on MLST was generated in MEGA X using the Maximum Likelihood method and Tamura-Nei model with 1000 bootstrap replicates. These virulence factor genes with more than 99% carriage were not displayed in this figure. For more details, see Table S3.