Figures & data
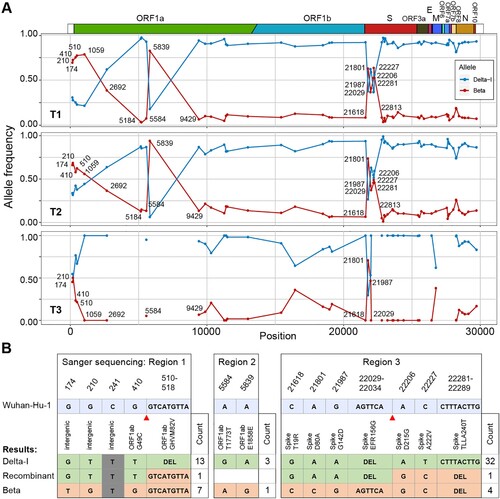
Figure 1. Signals of recombination in Case 49H. (A) The frequency of the Beta and Delta-I alleles in Case 49H. Only sites differing between the Delta-I genome and the Beta genome are shown. The frequency distribution are shown for different time-ponts (T1, T2 and T3). The missing sites on T3 were caused by limited sequencing depth in these regions. (B) The summary of haplotypes identified through TA clonal sequencing. Alleles that were identical to the Delta-I and Beta strain were labelled in different colours. Gray stands for non-informative sites (same allele possessed by two strains). The number of clones detected for each haplotype is labelled at the end of the sequences and the inferred recombination breakpoints are marked with red triangles.