Figures & data
Figure 1. Transcriptional profiles of genes encoding for scavenging enzymes. (A) Survival of Msm treated with H2O2. Exponential-phase Msm cultures were treated with different H2O2 concentrations for 50 min, survival was measured by tenfold serial dilution plating. (B) Scavenging enzymes that are responsible for degrading ROS. (C–E) Expression of katG, aphC, and sodA in Msm exposed to H2O2 for 50 min. Transcript levels were measured by the qRT-PCR, normalized relative to sigA, and expressed as Log2 fold change from untreated cultures. Data shown are mean ± SE with at least three independent experiments. *P < 0.05, **P < 0.01, ***P < 0.001, ****P < 0.0001.
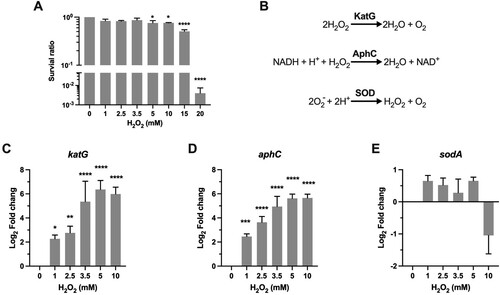
Figure 2. Transcriptional profiles of genes encoding for iron utilization. (A) Carton illustration of mycobacterial Fe acquisition system and its role in oxidative stress. Ms 1460–1466 are the M. smegmatis homologues of Mtb Rv1460-1466 cluster. (B–E) Expression of mbtB, irtA, ideR, and Ms1640 in Msm exposed to H2O2 for 50 min. Transcript levels were measured by the qRT-PCR, normalized relative to sigA, and expressed as Log2 fold change from untreated cultures. Data shown are mean ± SE with at least three independent experiments. **P < 0.01, ***P < 0.001, ****P < 0.0001.
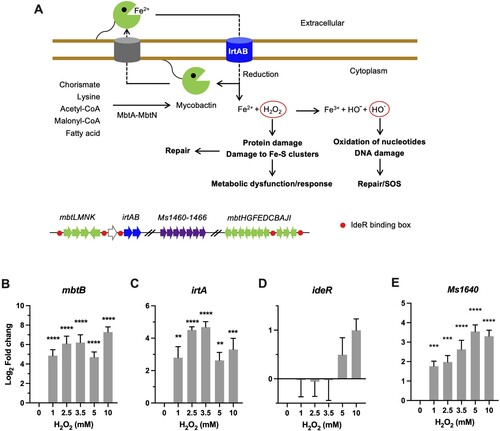
Figure 3. Transcriptional profiles of genes encoding for DNA repair proteins. (A) Illustration of H2O2-mediated damage to DNA and the repair systems. (B–D) Expression of recA, dnaE2, and mazG in Msm exposed to H2O2 for 50 min. Transcript levels were measured by the qRT-PCR, normalized relative to sigA, and expressed as Log2 fold change from untreated cultures. Data shown are mean ± SE with at least three independent experiments. *P < 0.05, **P < 0.01, ***P < 0.001, ****P < 0.0001.
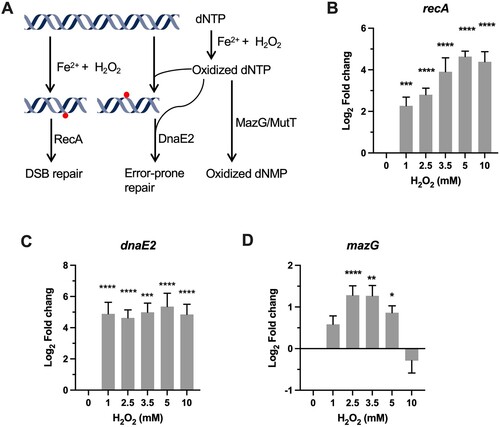
Figure 4 . Transcriptional profiles of genes encoding for metabolic enzymes involved in antioxidant defense. (A) Illustration of TCA, glyoxylate shunt, and methylcitrate cycle. Enzymes or enzyme complex involved in antioxidant response were shown as bold. PDH, pyruvate dehydrogenase; CIT, citrate; isoCIT, isocitrate; α-KG, α-ketoglutarate; α-KDH, α-ketoglutarate dehydrogenase; SUC-CoA, succinyl-CoA; SUC, succinic acid; SDH, succinate dehydrogenase; FUM, fumarate; MAL, malic acid; OAA, oxaloacetate; GLO, glyoxylate; PRO-CoA, propionyl-CoA; 2MC, 2 methylcitrate; 2MIC, 2 methylisocitrate. (B–F) Expression of icl, prpD, sdhA, fum, and aceE in Msm exposed to H2O2 for 50 min. Transcript levels were measured by the qRT-PCR, normalized relative to sigA, and expressed as Log2 fold change from untreated cultures. Data shown are mean ± SE with at least three independent experiments. *P < 0.05, **P < 0.01, ****P < 0.0001.
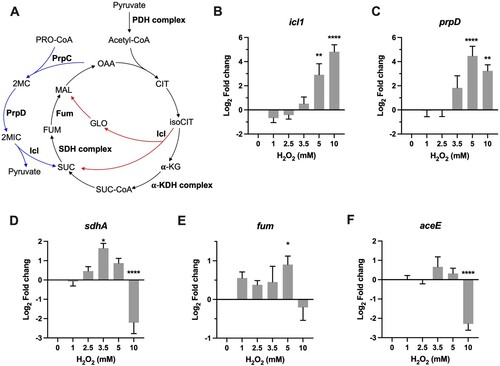
Figure 5 . Transcriptional profiles of genes encoding for protein repair and degradation. Expression of msrA, prcA, mpa, pafA, clpP1, clpX, and clpC1 in Msm exposed to H2O2 for 50 min. Transcript levels were measured by the qRT-PCR, normalized relative to sigA, and expressed as Log2 fold change from untreated cultures. Data shown are mean ± SE with at least three independent experiments. *P < 0.05, **P < 0.01, ****P < 0.0001.
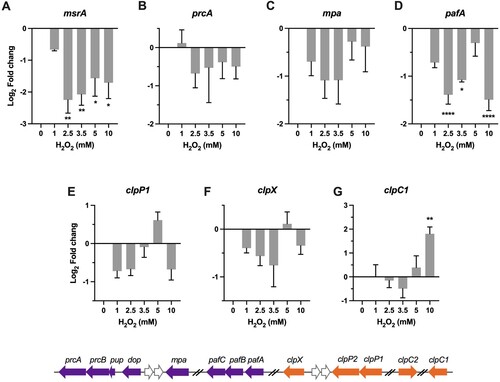
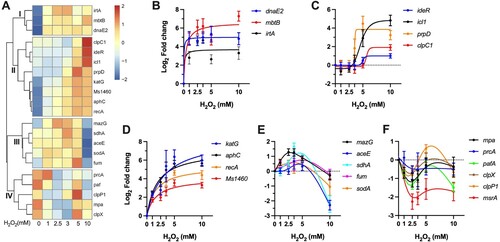
Figure 6. Profiles of coordinated gene regulation. (A) Heatmap showing the unsupervised hierarchical clustering based on the Log2 fold change values of tested genes. Colour shown represents Z-scored expression values. (B-F) H2O2 concentration-dependent expressional patterns of clustered genes. Data shown are mean ± SE with at least three independent experiments.