Figures & data
Table 1. Demographics and clinical information of recovered COVID-19 patients and vaccine recipients.
Figure 1. Comparison of microneutralization antibody (MN) titers between the Omicron variant and other variants or ancestral SARS-CoV-2 virus. Vaccine recipients (early): serum specimens collected from 34 vaccine recipients at a median of four days after the 2nd dose. Vaccine recipients (late): serum specimens collected from 21 vaccine recipients at a median of 44 days after the 2nd dose. Open circles represent the MN titer of each serum specimen. The MN titers from the same patient were connected by the dotted line. *** P < 0.001; **** P < 0.0001.
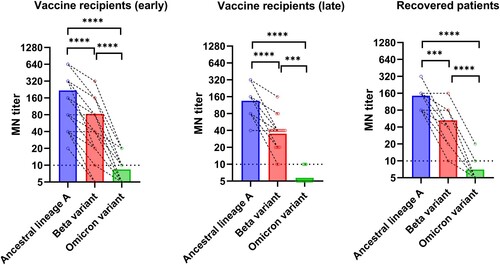
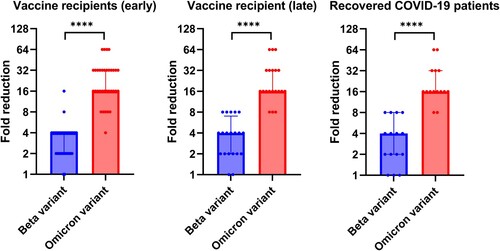
Figure 2. Fold reduction of microneutralization antibody titers when compared with ancestral lineage A virus. Median and interquartile range are shown.