
Figures & data
Table 1. Antimicrobial susceptibility profiles, isolates information and biofilm-production ability of colistin-resistance K. pneumoniae.
Figure 1. K. pneumoniae population structure and the prevalence of mcr gene and hvKp marker genes. The phylogeny in the left represents the population structure of 14 colistin-resistant isolated and 31 representative genomes of major global problem clones, with six hypervirulent clones (CG23, CG25, CG65, CG66, CG86, CG380) highlighted in blue branches, and 14 colistin-resistant isolated coloured in red text. Bootstrap values are also labelled on the nodes of the tree. The prevalence of mcr gene and hvKp marker genes are shown in the heatmap with whitespace separated. Different colors of the square in the heatmap represent the alignment identity for each gene (see the legend in the lower right section), with grey colour represents gene absence.
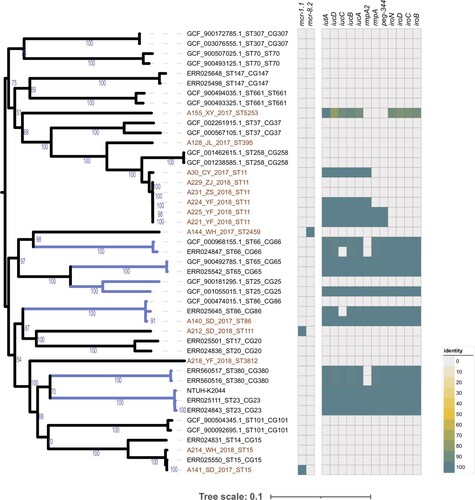
Figure 2. Relative expression of the pmrA, phoP, phoQ, mgrB, pmrC, and pmrK genes in colistin-resistant group and colistin-susceptible group. Values were represented by means of three independent replicates. Relative expression of pmrA, phoP, and phoQ in colistin-resistant group was significantly higher than colistin-susceptible group. There were 6 strains that less expressed mgrB gene, five strains harboured modified-mgrB gene and the rest strain were WT. However, because of early termination, overexpression of mgrB in one strain from ST11 could not form a protein with a negative regulatory function. *, P < 0.05; ns, not significantly different.
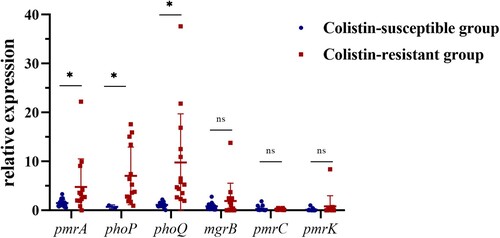
Table 2. Correlation coefficient between MIC and Chromosomal regulon gene expression.
Figure 3. Transcriptional level and substitution mutations of chromosomal regulators in colistin-resistant isolates. The top six bar plots show the transcriptional level of six chromosomal regulators, with the x-axis represents 14 colistin-resistant isolates, ordered according to their colistin MICs, see the colour scale under the bar plot of pmrK. The prevalence of substitution mutations identified in nine chromosomal regulators are displayed in the heatmap following the colistin MICs. Each row shows a mutation site of corresponding gene (see the rightmost text), with mutated isolated colored in purple and those with no corresponding variation in grey. Genes absent in isolates are colored in white. Mutation reported in previous studies are marked with * in the rightmost. Three newly identified mutations which we speculated might have relation to colistin resistance are highlighted in red text.
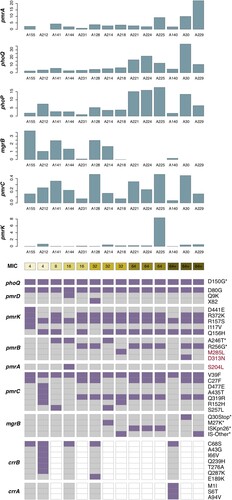
Table 3. Colistin-resistant genes mediated by plasmid and mutations in the chromosomal genes in K. pneumoniae.
Figure 4. Survival curve of six weeks CD1 mice after IP infection with colistin-resistance K. pneumoniae. Each group, with five mice included with one K. pneumoniae strain, either 5×10⁷ CFU of 14 CoRKp strains or NTUH-K2044, or 1×10⁸ CFU of low-virulent control QD110. Strain of ST86-K2 presented the highest level of virulence, more virulent than the reference strain NTUH-K2044, and six strains from ST11-K64/K47 showed intermediate virulence, except for ST111-K63 isolate, which showed weak virulenceto some extent. Isolate from ST5253-K28 was classic virulence. Data of classic-virulent strains from, with no death of mice occurring within 7 days, were not shown, as the survival consistent with QD110. P-values from the log-rank (Mantel-Cox) test were indicated as follows: *, P < 0.05; **, P <0.01; ns, not significantly different.
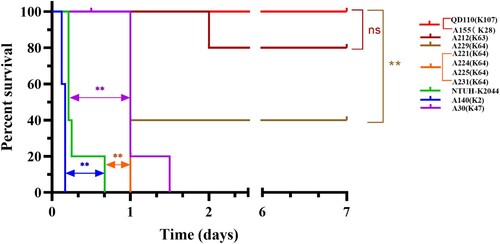
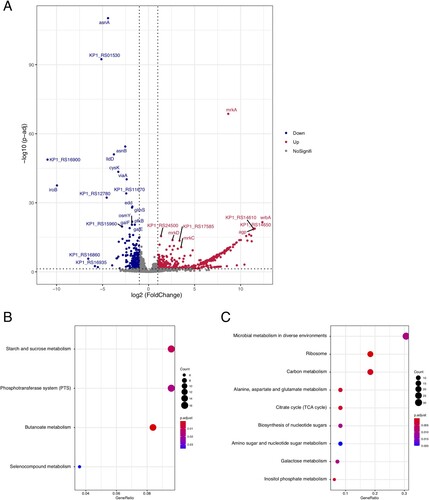
Figure 5. Differently expressed genes between colistin-resistant and colistin-sensitive isolates. (A) Volcano plots of the differently expressed genes. (B) Point plot of KEGG pathways for up-regulated genes. (C) Point plot of KEGG pathways for down-regulated genes.
Supplemental Material
Download Zip (9.2 MB)Data availability
The raw data of both whole-genome DNA and RNA sequencing data have been deposited in the NCBI Sequence Read Archive under BioProject ID PRJNA762527.