
Figures & data
Figure 1. Study design.
Note: Eight sheep were inoculated with a mixture of SARS-CoV-2/human/USA/WA1/2020 lineage A (referred to as lineage A WA1; BEI item #: NR-52281) and SARS-CoV-2/human/USA/CA_CDC_5574/2020 lineage B.1.1.7 (alpha VOC B.1.1.7; BEI item #: NR-54011) acquired from BEI Resources (Manassas, VA, USA). A 2 mL dose of 1 × 10⁶ TCID50 per animal was administered IN and PO. At 1-day post challenge (DPC), two sentinel sheep were co-mingled with the eight principal infected animals to study virus transmission. Daily clinical observations and body temperatures were performed. Nasal/oropharyngeal/rectal swabs, blood/serum and faeces were collected at 0, 1, 3, 5, 7, 10, 14 17 and 21 DPC. Postmortem examinations were performed at 4 (3 principal), 8 (3 principal) and 21 DPC (2 principal + 2 sentinels). BioRender.com was used to create figure illustrations.
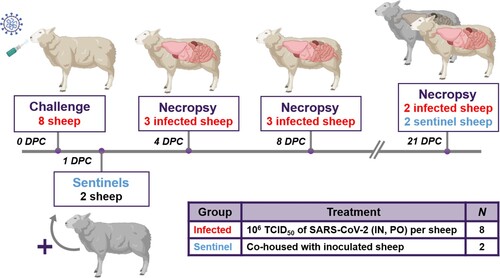
Table 1. Animal treatment assignments.
Figure 2. SARS-CoV-2 replication in ruminant-derived cell cultures.
Note: Primary ovine kidney cells, Madin-Darby ovine kidney cells, primary American pronghorn lung cells, bovine fetal fibroblasts (BFF) and Madin-Darby bovine cells were infected with SARS-CoV-2 USA-WA1/2020 at 0.1 MOI and cell supernatants collected at 0, 2, 4, 6 or 8 days post infection (DPI). Cell supernatants were titrated on Vero E6 cells to determine virus titres. Mean titres and SEM of at least two independent infection experiments per cell line are shown.
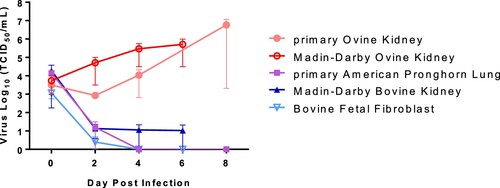
Figure 3. Viral RNA shedding of SARS-CoV-2-infected sheep.
Note: RT-qPCR was performed on nasal, oropharyngeal, and rectal swabs collected from principal infected (solid red symbols) and sentinel sheep (open blue symbols) on the indicated days post-challenge (DPC). Mean (n = 2) viral RNA copy number (CN) per mL based on the SARS-CoV-2 nucleocapsid gene are plotted for individual animals. Asterisks (*) indicate samples with one out of two RT-qPCR reactions above the limit of detection, which is indicated by the dotted line.
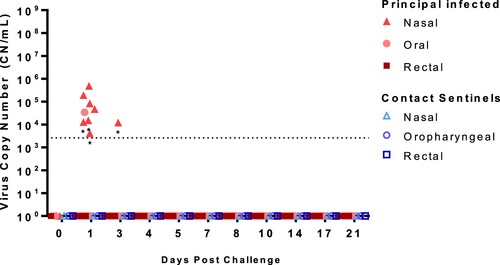
Figure 4. Viral RNA detected in tissues of SARS-CoV-2-infected sheep.
Note: RT-qPCR was performed on respiratory (A–C), lymphoid (D–F) and other (G–I) tissues of sheep euthanized at 4 (A,D,G), 8 (B,E,H), and 21 (C,F,I) days post challenge (DPC) to detect the presence of SARS-CoV-2-specific RNA. Mean (n = 2) viral RNA copy number (CN) per mg of tissue based on the SARS-CoV-2 nucleocapsid gene are plotted for individual animals. Asterisks (*) indicate samples with one out of two RT-qPCR reactions above the limit of detection, which is indicated by the dotted line. NS = no sample. Solid symbols indicate principal animals necropsied at 4, 8, and 21DPC; open symbols indicate sentinel animals necropsied at 21 DPC.
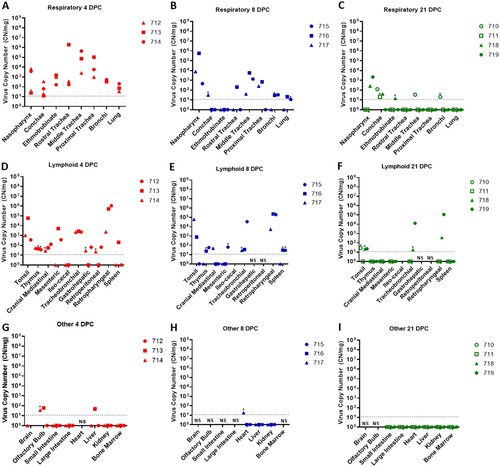
Figure 5. Serology of SARS-CoV-2 infected sheep.
Note: Detection of antibodies directed against the SARS-CoV-2 nucleocapsid protein (A), and the receptor binding domain (B) by indirect ELISA tests. The cut-off was determined by averaging the OD of negative serum + 3X the standard deviation as indicated by the dotted line. All samples with resulting OD values above this cut-off were considered positive. (C) Virus neutralizing antibodies detected in serum are shown as log2 of the reciprocal of the neutralization serum dilution. Sera were tested starting at a dilution of 1:20 with a 1:10 cut-off indicated by the dotted line. (D) Sera from principal infected (n = 8) and sentinel sheep (n = 2) were tested against the bovine coronavirus (BCoV) spike protein using an indirect ELISA; both, positive (C+) and negative (C−) bovine control sera were included. The cut-off was determined by averaging the OD of negative serum + 3X the standard deviation as indicated by the dotted line. A–D: Mean with SEM are shown.
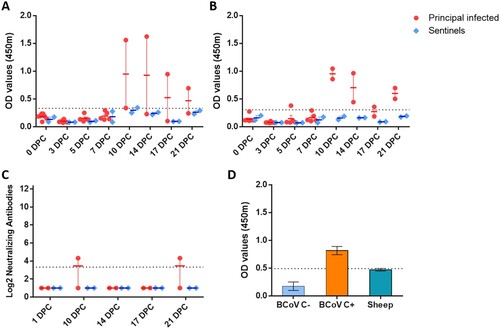
Figure 6. Histopathology and SARS-CoV-2 antigen distribution in the upper and lower respiratory tract of infected sheep at 4 and 8 DPC.
Note: Rostral turbinates (A and B), trachea (C and D), and lung (E and F) at 4 DPC. Minimal changes were noted in the rostral turbinates, with mild, dispersed and aggregates of lymphocytes. No viral antigen was detected (B). In the trachea, there were multifocal prominent aggregates of lymphocytes and plasma cells in the lamina propria and extending/transmigrating through the lining epithelium, with few individual cell degeneration and necrosis (C and inset [arrows]). Sporadic lymphoid aggregates showed viral antigen (D, arrow). In the pulmonary parenchyma, bronchioles and blood vessels were delimited by hyperplastic bronchus-associated lymphoid tissue (BALT) (E), no viral antigen was detected (F). Rostral turbinates (G and H), trachea (I and J), and lung (K and L) at 8 DPC. Rostral turbinates were within normal limits and no viral antigen was detected (G and H). The tracheal lamina propria had multiple prominent and dense lymphoid aggregates (I) but no evidence of viral antigen (J) or epithelial alterations. In the pulmonary parenchyma, bronchioles and blood vessels were frequently delimited by prominent BALT (K), no viral antigen was detected (L) H&E and Fast Red, 200× total magnification (A–D; G–J) and 100× total magnification (E and F; K and L).
![Figure 6. Histopathology and SARS-CoV-2 antigen distribution in the upper and lower respiratory tract of infected sheep at 4 and 8 DPC.Note: Rostral turbinates (A and B), trachea (C and D), and lung (E and F) at 4 DPC. Minimal changes were noted in the rostral turbinates, with mild, dispersed and aggregates of lymphocytes. No viral antigen was detected (B). In the trachea, there were multifocal prominent aggregates of lymphocytes and plasma cells in the lamina propria and extending/transmigrating through the lining epithelium, with few individual cell degeneration and necrosis (C and inset [arrows]). Sporadic lymphoid aggregates showed viral antigen (D, arrow). In the pulmonary parenchyma, bronchioles and blood vessels were delimited by hyperplastic bronchus-associated lymphoid tissue (BALT) (E), no viral antigen was detected (F). Rostral turbinates (G and H), trachea (I and J), and lung (K and L) at 8 DPC. Rostral turbinates were within normal limits and no viral antigen was detected (G and H). The tracheal lamina propria had multiple prominent and dense lymphoid aggregates (I) but no evidence of viral antigen (J) or epithelial alterations. In the pulmonary parenchyma, bronchioles and blood vessels were frequently delimited by prominent BALT (K), no viral antigen was detected (L) H&E and Fast Red, 200× total magnification (A–D; G–J) and 100× total magnification (E and F; K and L).](/cms/asset/af79c0ef-a400-479f-8b84-0df13365005a/temi_a_2037397_f0006_oc.jpg)
Table 2. SARS-CoV-2 competition in sheep co-infectedTable Footnotea with two strains determined by next generation sequencing.