
Figures & data
Figure 1. The distribution of patients under investigation (PUI) and cases during the study period.
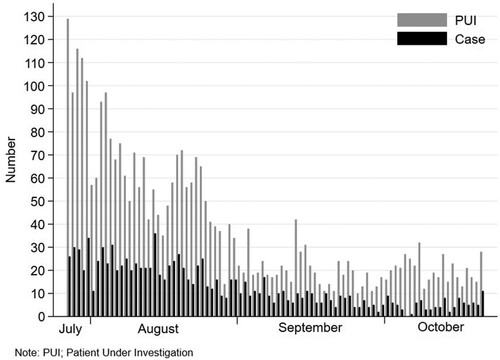
Table 1. Characteristics of the study cohort, cases and controls.
Figure 2. Vaccine Effectiveness according to the number of the dose received by the study participants. Notes: The VE was adjusted for being healthcare workers, comorbidities, age, educational level, and sex. I bars indicate 95% confidence intervals. IQR = interquartile range; NA = non-applicable.
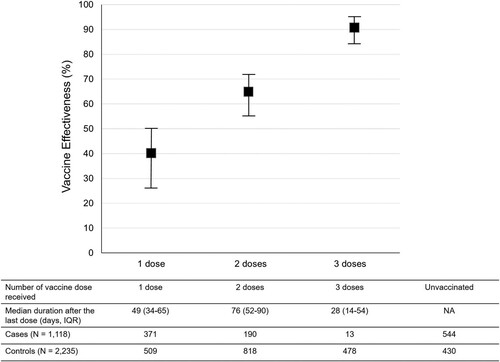
Figure 3. Vaccine effectiveness according to vaccine types and regimens received by the study participants. Notes: The VE was adjusted for being healthcare workers, comorbidities, age, educational level, and sex. I bars indicate 95% confidence intervals. IQR = interquartile range.
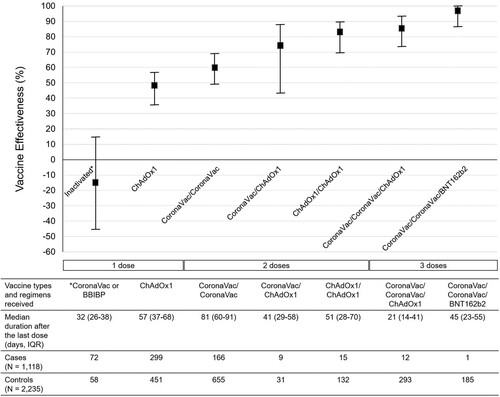
Table 2. COVID-19 vaccination status of the study participants stratified according to diseases status and severity.