
Figures & data
Table 1. Overlapping Peptide Pool 1.
Figure 1. Peptide pool 1 induced strong T cell responses in Balb/c mice. Balb/c mice (n = 5/group) were immunized twice two weeks apart with 25 μg pGX9501 or pVAX1 (empty vector). T cell responses were analyzed on day 14 after the second injection. (A) Splenocytes were harvested, and IFN-γ ELIspot T cell responses were measured after stimulation for 20 h with overlapping peptide pools 1 or 2. (B) Antigen-specific cytotoxic lymphocyte (CTL) killing activity was evaluated by an in vivo CTL assay. Target cells at 4 × 10⁶/ml from naïve mice were peptide-pulsed with pool 1 then labelled with a high concentration of eFlour450 in vitro. Control cells were non-peptide-pulsed cells and labelled with a low concentration of eFluor450. The cells were mixed and transferred i.v. into immunized mice. After 5 h, splenocytes were harvested, and the intensity of eFlour450 peptide labelled target cells was compared with the non-peptide-labelled negative control cells by flow cytometry. pVAX1-s-WT was made from the wild type sequence of the full-length spike protein of the SARS-CoV-2(SARS-CoV-2/WH-09/human/2020/CHN) was subcloned into the pVAX1. The sequence of the same region was optimized via SynCon technology, synthesized, and cloned into pVAX1 as the pGX9501.
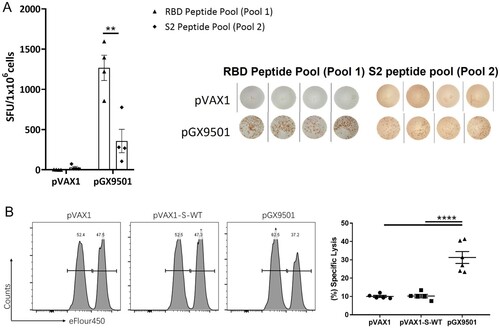
Figure 2. IEDB prediction scores of peptides in pool 1. CTL epitope peptides were screened by integrating MHC-I binding prediction, MHC-I immunogenicity (A), and MHC-NP (B) prediction from three H-2d MHC-I alleles. The numbers on the graph are the peptide identification numbers. The different colours are corresponding to each peptide ID.
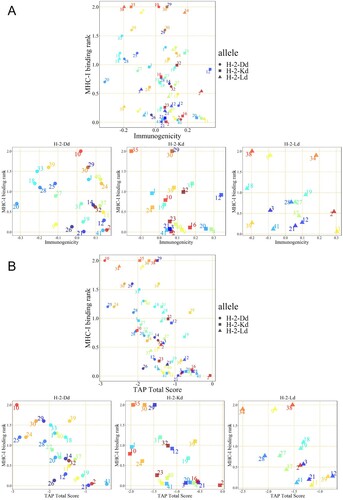
Figure 3. Peptide 2 is identified as a CD8+ CTL epitope. Balb/c mice were immunized with the pGX9501. (A) Splenocytes were obtained and used to analyze antigen-specific T-cell induction in the IFN-γ ELIspot assay using in vitro stimulation with the indicated peptides (the peptide with an MHC-I binding RANK < 2 and showing the highest TAP total score or Immunogenicity score in different alleles) was selected for the IFN-γ ELIspot assay. (B) CD4+ T cells and (C) CD8+ T cells were sorted, and specific T-cell induction of IFN-γ-secretion was assayed.
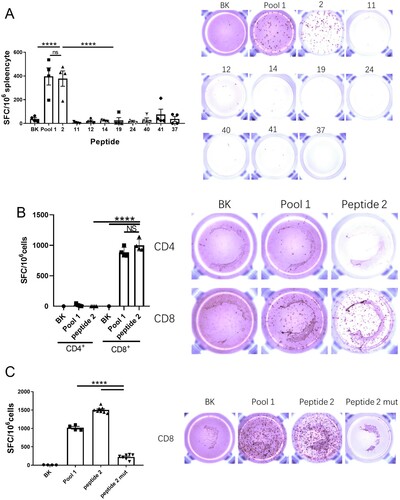
Table 2. MHC-I epitope analysis for Overlapping Peptide Pool 1.
Figure 4. Conserved Sequence & MHC-I HLA Analysis of Peptide 2. (A) The sequence of Peptide 2 was highly conserved in the 11 virus variants that have been identified as the variants of interest and the variants of concern, as published by WHO. (B) Position of Peptide 2 (yellow marked segment) in the stereoscopic structure of the spike protein. (C) The global distribution of HLA alleles. (D) Analysis of Peptide 2 by integration of MHC-I binding prediction, MHC-I immunogenicity, and MHC-NP prediction from the HLA alleles.
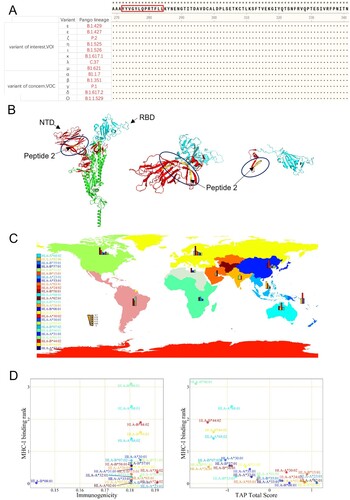
Table 3. Geographic Distribution of HLA allele.
Table 4. Human MHC-I epitope analysis for peptide 2.