Figures & data
Table 1. The clinical characteristics of the chronic HBV-infected patients in cohort A.
Table 2. The clinical characteristics of the CHB patients in cohort B.
Table 3. The clinical characteristics of the CHB patients in cohort C.
Table 4. Sequences of primers and probes.
Figure 1. The accuracy and sensitivity of HBV RNA detection at preC/C-RNA, SF-RNA and XR-RNA regions were assessed by the National Standard of HBV RNA. (A) The diagram of HBV pgRNA and the relative locations of preC/C-RNA, SF-RNA and XR-RNA regions targeted by qPCR primers. SP: pgRNA splicing variant; *SP1-3 were the pgRNA splicing variants identified in our previous study.26 (B) The accuracy on the detection of HBV RNA at preC/C-RNA, SF-RNA and XR-RNA regions was assessed by HBV RNA standards. (C) The sensitivity on the detection of HBV RNA at preC/C-RNA, SF-RNA and XR-RNA regions was precisely analysed by HBV RNA standards. The lowest concentration of 95% positive was considered as the LLOD.
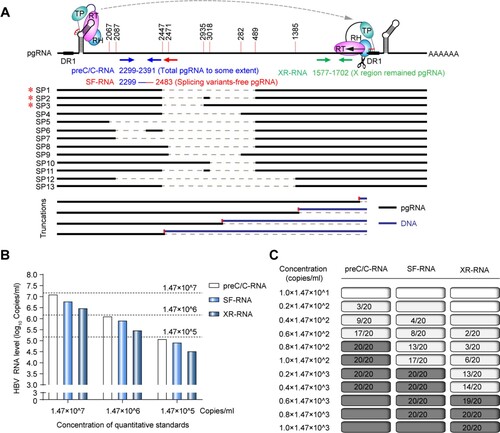
Figure 2. Comparative analysis of HBV RNA levels detected at preC/C-RNA, SF-RNA and XR-RNA regions in the sera of treatment-naïve chronic HBV-infected individuals. (A) The levels of serum HBV RNA in the sera of 35 treatment-naïve chronic HBV-infected individuals were detected at preC/C-RNA, SF-RNA and XR-RNA regions. (B) The levels of HBV RNA between HBeAg-positive (n = 20) and HBeAg-negative groups (n = 15) were detected at preC/C-RNA, SF-RNA and XR-RNA regions. (C) The bias of serum HBV RNA levels detected at preC/C-RNA and SF-RNA, preC/C-RNA and XR-RNA regions were analysed by Bland Altman plot method. (D) Serum HBV RNA was reverse-transcribed and amplified by nested-PCR. The PCR products were analysed by 1.0% agarose gel electrophoresis. (E) Sequencing analysis of SP1. Statistical significance shown as the p value was evaluated by a One-way ANOVA with Bonferroni’s multiple comparisons and Paired Mann–Whitney U test. eff%: amplification efficiency.
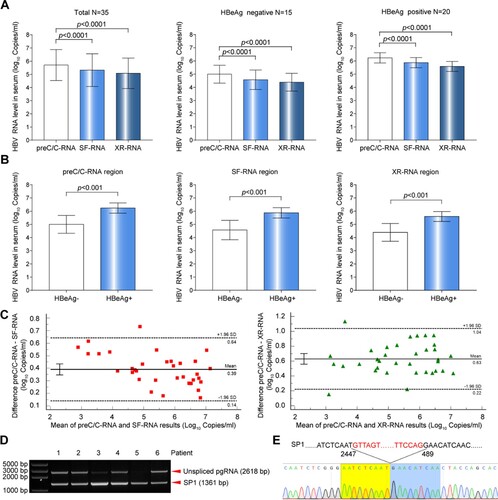
Figure 3. Comparative analysis of HBV RNA levels detected at preC/C-RNA, SF-RNA and XR-RNA regions in the sera of CHB patients under NAs treatment. (A) The levels of HBV RNA were quantitatively detected at preC/C-RNA, SF-RNA and XR-RNA regions in the sera of CHB patients (n = 52) under NAs treatment for 48 weeks. (B) The bias of serum HBV RNA levels detected at preC/C-RNA and SF-RNA regions were analysed by Bland Altman plot method. (C) The bias of serum HBV RNA levels detected at preC/C-RNA and XR-RNA regions were analysed by Bland Altman plot method. The mean difference was given (y axis) for the mean results (x axis). (D) The levels of HBV RNA were quantitatively detected at preC/C-RNA, SF-RNA and XR-RNA regions in rapid decline group and (E) slow decline group. (F) The levels of HBV RNA were detected at preC/C-RNA, SF-RNA and XR-RNA regions in the sera of CHB patients (n = 8) under NAs treatment for 5 years. (G) The levels of serum HBV RNA in each CHB patient under NAs treatment for 5 years were quantitatively detected at preC/C-RNA, SF-RNA and XR-RNA regions. The white block represented the level was lower than LLOD. Statistical significance shown as the p value was evaluated by a Paired Mann–Whitney U test.
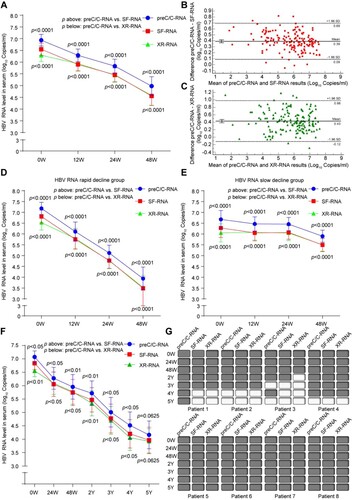
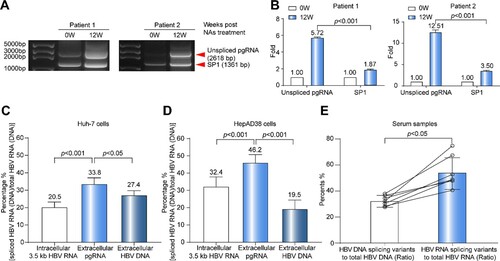
Figure 4. Analysis on the reverse transcription efficiency between pgRNA splicing variants and unspliced pgRNA. (A) HBV RNA in the sera of two CHB patients was reverse-transcribed and amplified by nested-PCR at baseline and 12 weeks post NAs treatment. The PCR products were analysed by 1.0% agarose gel electrophoresis. (B) The gray value analysis on the levels of unspliced pgRNA and SP1 with ImageJ Software. To avoid the difference in band strength due to the difference of amplification efficiency, the comparisons of fold changes between 0 and 12 weeks were conducted in the same sets. (C) The proportions of intracellular 3.5 kb HBV RNA splicing variants, extracellular pgRNA splicing variants and HBV DNA splicing variants were analysed in Huh-7 cells transfected with prcccDNA plasmids and (D) HepAD38 cells. (E) The ratio of splicing variants in serum HBV DNA and RNA in 7 CHB patients of cohort A. SP1: pgRNA splicing variant 1. Statistical significance shown as the p value was evaluated by a Paired Mann–Whitney U test.