
Figures & data
Figure 1. Metformin attenuated CLP-induced liver inflammation and injury in aged rats. (A,B) H&E staining showed significantly increased inflammatory infiltration, oedema, and haemorrhage of liver tissues in the CLP group than SC and SC-MET groups, whereas these abnormalities were markedly reduced in the CLP-MET group (bar = 50 μm; n = 3/group). (C,D) TUNEL assay results in four groups showed that the hepatocyte apoptosis increased in the CLP group and decreased in the CLP-MET group (n = 3/group). (E-I) The RT-PCR experiment showed that compared with SC and SC-MET groups, the expression of inflammatory factors TNF-α, IL-6, and chemokines ccl2, cxcl1, and ccl4 were elevated in the CLP group and decreased in the CLP-MET group. *P < 0.05, **P < 0.01, ***P < 0.001 (n = 3/group).
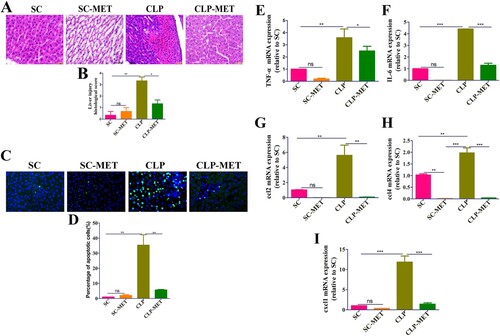
Figure 2. The effect of metformin on inflammation and intestinal barrier of the colon in aged rats. (A,B) H&E staining indicated that inflammatory infiltration, oedema, and haemorrhage of colon tissues significantly increased in the CLP group compared with SC and SC-MET groups, whereas these abnormalities improved in the CLP-MET group (bar = 100 μm). (C,D) The IHS expression results of claudin-3 protein expression (bar = 50/100 μm). *P < 0.05, **P < 0.01, ***P < 0.001 (n = 3/group).
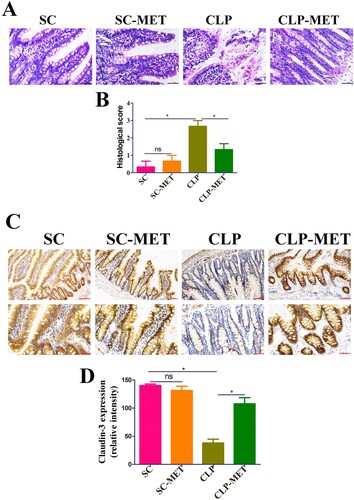
Figure 3. The effect of metformin on SLI was transmissible by affecting the susceptibility of gut microbiota. (A) FMT experimental design: Twelve rats received antibiotics (vancomycin, 100 mg/kg; neomycin sulphate, 200 mg/kg; metronidazole, 200 mg/kg; and ampicillin, 200 mg/kg) intragastrically once a day for 5 days to deplete the gut microbiota, producing Twelve pseudo-germ-free aged rats (recipient rats). Among them, 6 were transplanted with the CLP-treated faeces (n = 10) and 6 were transplanted with CLP-MET-treated feces (n = 10) once a day for 3 days. Thereby, FMT-CLP (n = 6) and FMT-MET groups (n = 6) were obtained, respectively. Faeces from donor rats (10 rats in CLP and CLP-MET groups, respectively) were collected and resuspended in phosphate buffer saline (PBS) at 0.125 g/mL, then 0.15 mL of this suspension was administered to rats by oral gavage once a day for 3 days. After 3 days, rats were subjected to CLP and sacrificed 24 h later, at which time tissues were collected. (B,C) H&E staining and the histological score of the liver from donors and sacrificed rats. (D,E) Hepatic TUNEL assay and quantification of donors and sacrificed rats. (F-J) The RT-PCR experiment showed that compared with CLP-MET and FMT-MET groups, the expression of inflammatory factors TNF-α, IL-6, and chemokines ccl2, cxcl1, and ccl4 were elevated in CLP and FMT-CLP groups. *P < 0.05, **P < 0.01, ***P < 0.001 (n = 3/group).
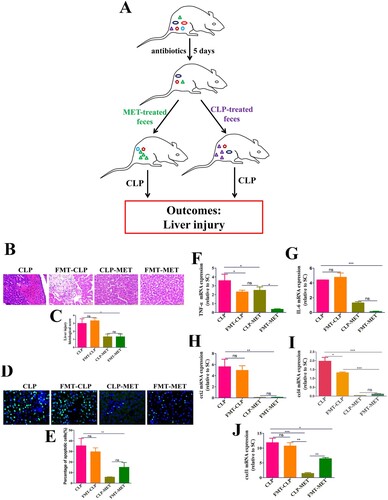
Figure 4. The effect of metformin on inflammation and intestinal barrier of the colon in the FMT experiment. (A,B) H&E staining indicated that inflammatory infiltration, oedema, and haemorrhage of colon tissues significantly increased in CLP and FMT-CLP groups compared with CLP-MET and FMT-MET groups (bar = 50 μm). (C,D) The IHS expression results of claudin-3 protein expression (bar = 50/100 μm). *P < 0.05, **P < 0.01, ***P < 0.001 (n = 3/group).
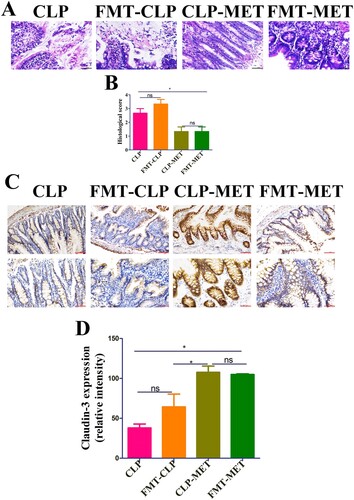
Figure 5. The effect of metformin on the diversity of gut microbiota in aged rats. (A,B) 16S rRNA gene sequencing analysis showed that the alpha diversity of gut microbiota, such as Chao1 and Shannon indices, was dramatically reduced in the CLP group compared with the SC group, whereas the alpha diversity was reversed in the CLP-MET group. (C,D) Beta diversity of gut microbiota, whose unweighted UniFrac NMDS analysis showed that the composition of the CLP group was different from that of SC and SC-MET groups. However, the composition of gut microbiota in the CLP-MET group was similar to the SC group (n = 5/group).
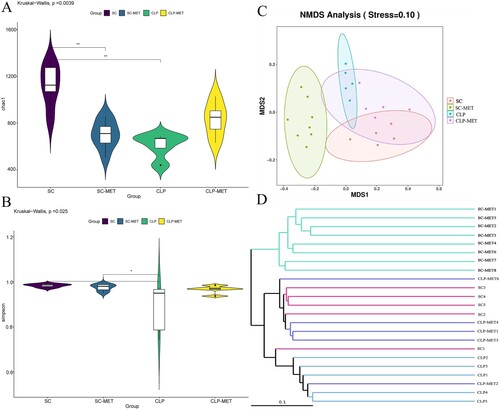
Figure 6. The beneficial effect of metformin on gut microbiota in aged rats. (A) The gut microbiota showed differences among SC, SC-MET, CLP, and CLP-MET groups in the phylum level. The relative abundance of Bacteroidetes decreased in CLP and SC-MET groups compared with the SC group, but it was reversed in the CLP-MET group. (B) The Genus-level gut microbiota showed differences among SC, SC-MET, CLP, and CLP-MET groups. (C-H) The abundance of Escherichia_Shigella, Klebsiella increased in the CLP group compared with SC and SC-MET groups, but it was reversed in the CLP-MET group; the relative abundance of Bifidobacterium, Muribaculaceae, Parabacteroides_distasonis, and Alloprevitella decreased in the CLP group compared with SC and SC-MET groups, and it was increased in the CLP-MET group. (I) The ratio of Firmicutes/Bacteroidetes slightly increased in SC-MET and CLP groups compared with the SC group. However, metformin treatment could slightly decrease the ratio of Firmicutes/Bacteroidetes compared with the CLP group. *P < 0.05, **P < 0.01, ***P < 0.001.
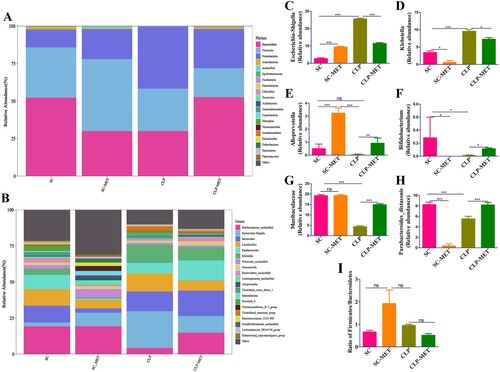
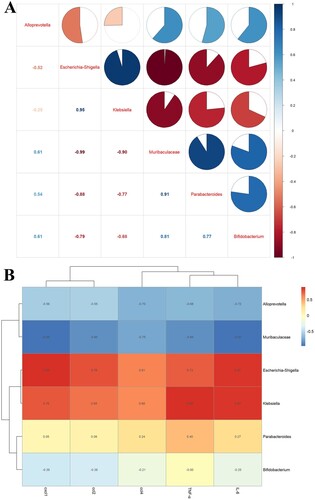
Figure 7. The correlation analysis of the gut microbiota and liver inflammation in aged rats. (A) The correlation analysis of the gut microbiota showed that Escherichia_Shigella, Klebsiella were negatively correlated with Alloprevitella, Bifidobacterium, Muribaculaceae, and Parabacteroides_distasonis; Muribaculaceae was positively correlated with Parabacteroides_distasonis and Bifidobacterium. (B) The correlation analysis between gut microbiota and liver inflammation showed that TNF-α, IL-6, ccl2, cxcl1, and ccl4 of the liver showed a positive correlation with Escherichia_Shigella, Klebsiella, and a negative correlation with Muribaculaceae and Alloprevitella.
Supplemental Material
Download Zip (8.4 MB)Data availability statement
The data that support the findings of this study are available from the corresponding author upon reasonable request.