
Figures & data
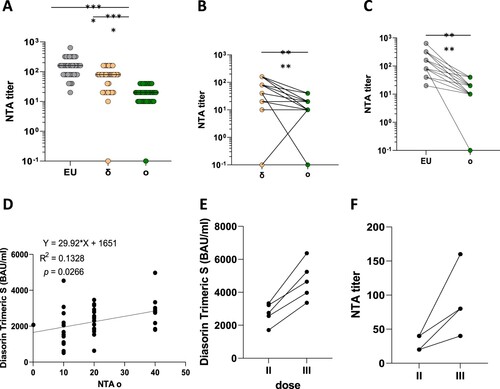
Figure 1. SARS-CoV-2 variants of concern (VOC). Panel (A) Neutralization assay (NTA) performed on the SARS-CoV-2 lineage B.1 (EU) and 2 VOCs, d and o. Panels B and C comparison between the Omicron variant and the EU and delta variant, respectively. Lines connect the NTAs of each individual subject. Panel D shows the correlation between anti-SARS-CoV-2 specific antibodies and neutralization assays (NTA) measured 1 month post two doses of the BNT162b2 vaccine. Three weeks after a third dose both antibody titres (Panel E) and neutralizing activity (NA) (Panel F) increased. **** = p <0.0001.
Data availability statement
The data that support the findings of this study are available from the corresponding author, D.M., upon reasonable request.