Figures & data
Figure 1. Antibody response after two-dose of inactivated vaccination and booster vaccination with RBD subunit or inactivated vaccination. (a) Total anti-S + N antibody titre of two doses of inactivated vaccines, n = 33 at D7, D14, 1, 3 M, n = 21 at 6 M. (b) Total anti-RBD antibody titre of two doses of inactivated vaccines, n = 33 at D7, D14, 1M, 3M, n = 21 at 6M. (c) Neutralizing antibody titre based on ACE2 competition assay of two doses of inactivated vaccines, n = 33 at D7, D14, 1M, 3M, n = 21 at 6M. (d) Neutralizing antibody titres against Wuhan-1 and Omicron strains for two doses of inactivated vaccines, n = 20 for Wuhan-1 and Omicron at 1M, n = 14 for Wuhan-1 and Omicron at 3M. (e) Comparison of total anti-S + N antibody titer between I-I-I and I-I-S, n = 28 in I-I-I, n = 27 in I-I-S. (f) Antibody response in booster groups evaluated by anti-RBD IgG, n = 28 in I-I-I, n = 27 in I-I-S. (g) Antibody response in booster groups evaluated by Neutralizing antibody titre based on ACE2 competition assay, n = 28 in I-I-I, n = 27 in I-I-S. ns, not significant; *P < 0.05, **P < 0.01, ****P < 0.0001.
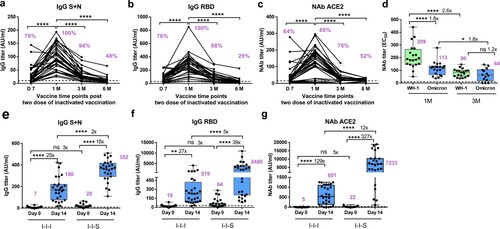
Figure 2. Neutralizing activity comparison between I-I-I and I-I-S. (a) Pseudovirus-based neutralizing response after two strategies of booster vaccinations against Wuhan-1 and VOCs, including, B.1.1.7 (Alpha Variant), B.1.351 (Beta Variant), P.1 (Gamma Variant), B.1.617.2 (Delta Variant) and C37 (Lambda Variant) strains. (b) EC50 titer after third shot of inactivated vaccine against Wuhan-1 stain (n = 20). (c) EC50 titer after third shot of RBD recombinant subunit vaccine against Wuhan-1 stain (n = 25). (d) Comparison of the neutralizing titer based on pVNT against Omicron strain between I-I-S (n = 25) and I-I-I (n = 20). (e) Neutralizing antibody titres against Wuhan-1 strain and Omicron strain for I-I-S (n = 25) and I-I-I (n = 20) evaluated by conventional virus neutralization test. **P < 0.01, ***P < 0.001, ****P < 0.0001.
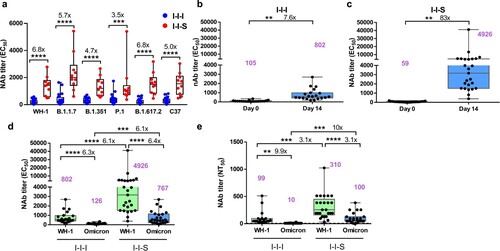
Table 1. Neutralizing antibody titre against Wuhan-1 strain and different variants of concern.
Figure 3. Duration of neutralizing antibody titres after booster vaccinations. (a, b) Long-term profile of EC50 titers based on pVNT against Wuhan-1 strain and Omicron strain for I-I-I group (n = 20 at D0 and D14, n = 13 at 1M). (c, d) Long-term profile of EC50 titres based on pVNT against Wuhan-1 strain and Omicron strain for I-I-S group (n = 25 at D0 and D14, n = 23 at 1M, n = 10 at 3M). (e, f) NT50 titres against Wuhan-1 strain and Omicron strain at D0, D14 and 1M post inactivated booster vaccination (n = 20 at D0 and D14, n = 13 at 1M). (g, h) NT50 titres against Wuhan-1 strain and Omicron strain at D0, D14, 1M and 3M post RBD subunit booster vaccination (n = 25 at D0 and D14, n = 23 at 1M, n = 10 at 3M). ns, not significant; *P < 0.05, ***P < 0.001, ****P < 0.0001.
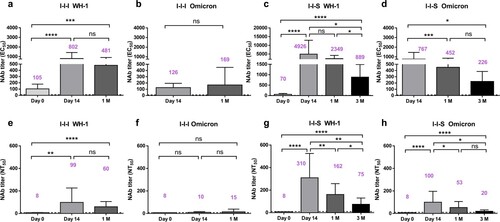
Figure 4. Neutralizing antibody titres against monoclonal antibodies 13G2 and 08B3 after booster vaccinations. (a) Comparison of neutralizing antibody titers based on monoclonal antibody 13G2 between I-I-I and I-I-S. n = 25 in I-I-I, n = 27 in I-I-S. (b) Neutralizing antibody titres against monoclonal antibody 08B3 for I-I-I and I-I-S group samples. n = 25 in I-I-I, n = 27 in I-I-S. ns, not significant; *P < 0.05, **P < 0.01, ****P < 0.0001.
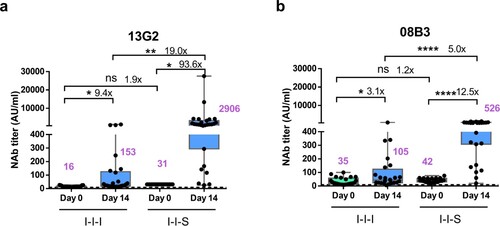
Figure 5. The portion of neutralizing epitopes targeted by booster vaccinations. (a) The portion of neutralizing antibody titre compared to total anti-S + N antibody for I-I-I and I-I-S groups. (b) The portion of neutralizing antibody titre compared to total anti-RBD antibody for I-I-I and I-I-S groups. The portion of neutralizing antibodies represented by monoclonal antibodies 13G2 (c) and 08B3 (d) compared to neutralizing antibody for I-I-I and I-I-S groups at D14 post booster vaccination. n = 20 in I-I-I, n = 25 in I-I-S. ns, not significant; *P < 0.05, ***P < 0.001, ****P < 0.0001.
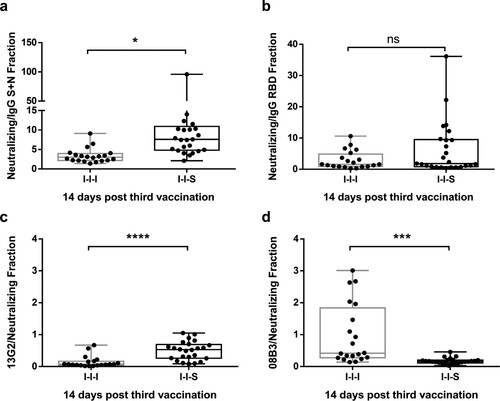
Figure 6. Different composite pattern between booster vaccination and breakthrough infection. (a) Neutralizing antibody titre against Wuhan-1 stain for samples collected at D14 post booster vaccinations and D14 post breakthrough infection. n = 20 in I-I-I, n = 10 in I-I-S, n = 16 in recovered Delta breakthrough patients. (b, c) The portion of neutralizing antibody titre compared to total anti-S + N and anti-RBD antibody at 1M post two-dose vaccination, post booster vaccinations and post breakthrough infection. n = 20 in I-I, n = 13 in I-I-I, n = 23 in I-I-S, n = 11 in Delta-Recovery. (d, e) The portion of neutralizing antibodies represented by monoclonal antibody 13G2 or 08B3 compared to total neutralizing antibody for vaccination samples and breakthrough infection samples. n = 13 in I-I-I, n = 23 in I-I-S, n = 11 in Delta-Recovery. ns, not significant; *P < 0.05, ***P < 0.001, ****P < 0.0001.
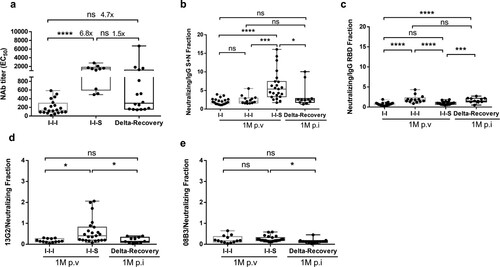
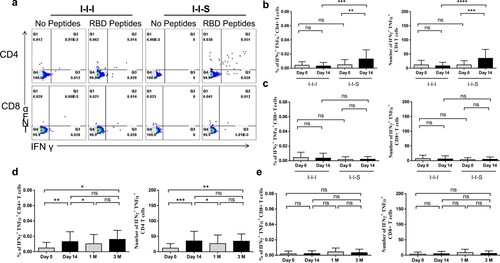
Figure 7. Cell responses after booster vaccinations. (a) Representative dot plots showing IFN-γ and TFN-α expression in CD4 + and CD8+ T cells after peptides stimulation at D14 post booster vaccination. (b) The percentages (left panel) and number/million PBMC (right panel) of IFN-γ+TFN-α+ CD4+ T cells after booster vaccination. (c) The percentages (left panel) and number/million PBMC (right panel) of IFN-γ+TFN-α+ CD8+ T cells after booster vaccination. n = 24 in I-I-I, n = 27 in I-I-S. IFN-γ+TFN-α+ CD4+ T cell response (d) and IFN-γ+TFN-α+ CD8+ T cell response at different time points post RBD recombinant subunit booster vaccination (e). n = 27 at D0 and D14, n = 23 at 1M, n = 10 at 3M. ns, not significant; *P < 0.05, **P < 0.01, ***P < 0.001, ****P < 0.0001.