Figures & data
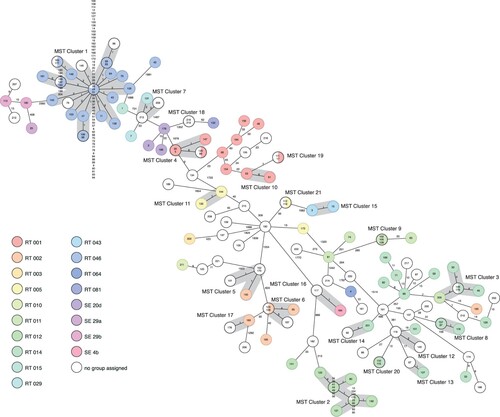
Figure 1. Flowchart of isolates included in the study from Högland Hospital catchment area, 2010–2011.
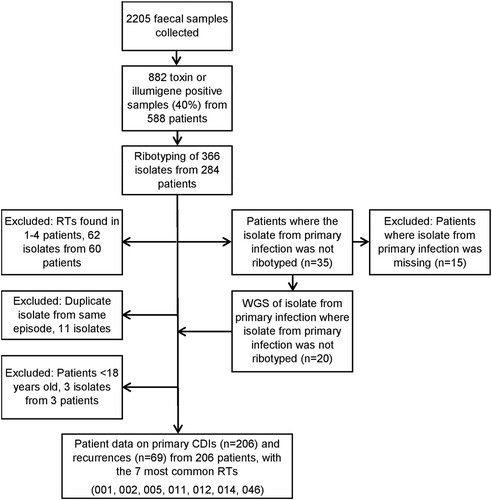
Figure 2. Timeline for CDI outbreak and interventions at Högland Hospital. Epidemiological curve showing CDI cases caused by RT046 at different wards at Högland Hospital during the outbreak (2010–2011) and CDI cases/10,000 bed days (July 2011–2013).
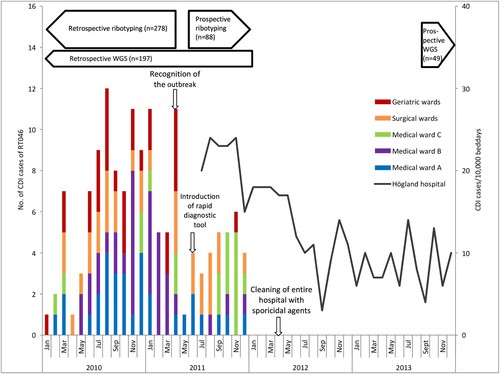
Table 1. Clinical characteristics of patients with primary Clostridioides difficile infection caused by PCR ribotype 046 compared to the six next most common ribotypes (comparison group).
Figure 3. One-year survival rate after CDI among patients infected with C. difficile of RT046 (dashed line) compared to the comparison group (continuous line).
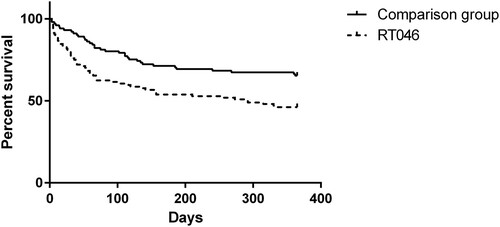
Table 2. Risk factors for 30-day mortality among patients with Clostridioides difficile infection.
Table 3. Antibiotic treatment for primary Clostridioides difficile infection caused by ribotype 046 compared to the six next most common ribotypes (comparison group).
Figure 4. Ridom SeqSphere+ minimum spanning tree (MST) for 222 samples based on 2583 targets, pairwise ignoring missing values. Each colour of the circles represents a different ribotype. The size of the circles is not proportional to the number of isolates. The number on the lines shows the number of allelic differences. The length of the lines is not proportional to the allelic differences. Each number in the circles represents a single isolate and is according to the sampling date.