Figures & data
Table 1. Clinical characteristics of study population.
Figure 1. Detection of HIV p24 protein and HIV RNA in spermatozoa. (A) HIV p24 protein detected in semen cells from HIV-infected men by imaging flow cytometry. Left picture (p24-PE, CD4-BV605); right picture (p24-FTC, CD4-APC/Cy7). (B) HIV p24 detected in spermatozoon of HIV-infections in the TN group (b-c, black arrow) and healthy controls (a) via immunohistochemical analysis. The sperm nuclei are stained light blue with hematoxylin, and p24 Ab signal is red. (C) a–d, HIV RNA detected in spermatozoon from treatment-naïve (TN) HIV-infected patients using RNAscope; HIV RNA cannot be detected in spermatozoa from antiretroviral (ART) HIV-infected patients (e) and healthy men (f). Green fluorescence represents HIV RNA, and blue fluorescence represents nucleic acid in the sperm nucleus. (D) HIV p24-positive rates of spermatozoon in the TN and anti-retroviral therapy (ART) groups. (E–F) Linear regression between the ratio of p24+ spermatozoa and baseline plasma HIV RNA and baseline CD4+ T cell count. HIV p24-positive rates of spermatozoa were calculated from imaging flow cytometry cell counting. The Mann–Whitney U nonparametric test was used to compare the two groups. *P < 0.05. r, Pearson correlation coefficient. P < 0.05 is considered significant. The dotted line represents the 95% confidence interval.
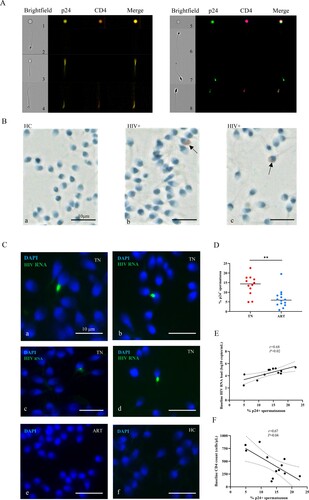
Figure 2. Receptor CD4 and co-receptor CCR5 or CXCR4 levels of the spermatozoa. (A) CD4 levels of spermatozoa in semen from HIV-infected men and healthy men. (B) CD4 levels of p24+ spermatozoa. (C) CCR5 or CXCR4 levels of spermatozoon from HIV-infected men and healthy men. (D) CCR5 or CXCR4 levels on p24+ spermatozoa from HIV-infected men. (E) CCR5 or CXCR4 levels of p24- and p24+ spermatozoa in the TN and ART groups. (F) CCR5- or CXCR4-positive spermatozoa from HIV-infected men detected using imaging flow cytometry. CCR5-FITC; p24-PE; CD4-BV605; CXCR4-APC; CD3-APC/Cy7. The Mann–Whitney U nonparametric test was used to compare the two groups. ns, not significant.
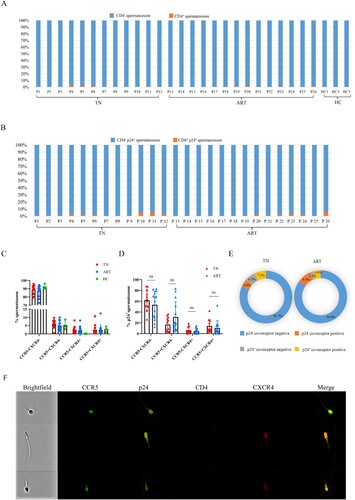
Figure 3. CCR5 or CXCR4 levels on CD4+ T cells in semen. (A) p24-positive rates of CD4+ T lymphocytes in semen from HIV-infected men in the TN and ART groups. (B) CCR5 or CXCR4 levels of CD4+ T cells in the semen of HIV-infected men and healthy men. (C) CCR5 or CXCR4 levels of p24+ CD4+ T cells in semen of the TN and ART groups. (D) CCR5 or CXCR4 levels of p24-CD4+ T cells and p24+ CD4+ T cells in semen of the TN and ART groups; either CCR5 or CXCR4 positive belongs to the co-receptor-positive group. (E) CD4+ T lymphocytes in semen detected on imaging flow cytometry. CCR5-FITC; p24-PE; CD8-Percp/Cy5.5; CD56-BV421; CD4-BV605; CXCR4-APC; CD3-APC/Cy7. The Mann–Whitney U nonparametric test was used to compare the two groups. *P < 0.05, **P < 0.01, ***P < 0.001. ns, not significant.
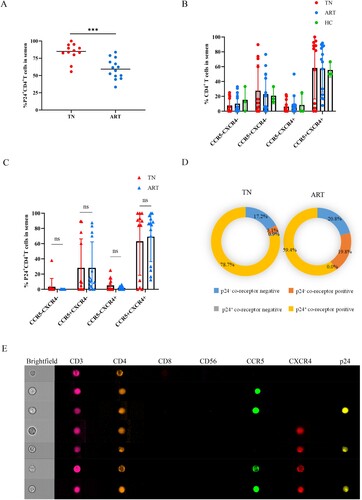
Figure 4. Proportions of p24+ cells in semen. Proportion of spermatozoa (A) and CD4+ T cells (B) in semen of HIV-infected men and healthy men. (C–D) Comparisons of p24-positive rates of spermatozoa and CD4+ T cells in the TN and ART groups. (E) Proportions of p24+ spermatozoa and p24+ CD4+ T lymphocytes of total p24 positive cells in semen. *P <0.05, **P <0.01, ***P <0.001. ns, not significant.
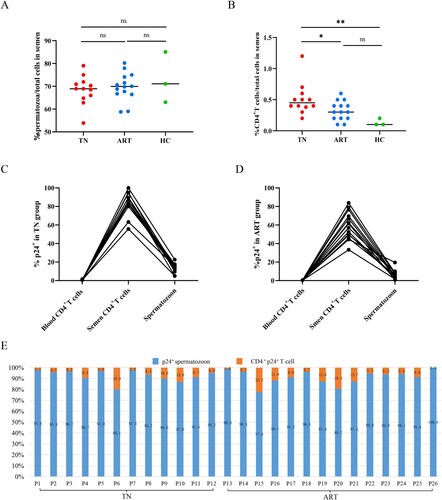
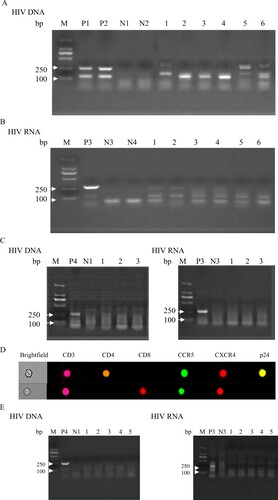
Figure 5. Co-culture of HIV nucleic acid detected in purified spermatozoa from HIV-infected men with PBMCs of healthy men. Purified spermatozoa from the TN group co-cultured with CD8-deleted PBMCs from healthy men. (A) HIV DNA detected from co-cultured cells and (B) HIV RNA extracted from the co-culture supernatant reverse transcribed into cDNA and used for nested PCR. (C) HIV DNA and RNA extracted from spermatozoa of three untreated HIV-infected men and cultured alone. (D) HIV-infected CD4+ T co-cultured with purified spermatozoon from untreated HIV infections. (E) HIV DNA and RNA extracted from purified spermatozoon of HIV-infections under ART co-cultured with CD8-deleted PBMCs of healthy men. Positive results valued as one of the 122 base pair and 264 base pair target bands positive; negative result was valued otherwise. M, DNA marker; P1, P2 and P4, DNA extracted from PBMCs of untreated HIV-infected men as positive controls; P3, HIV RNA extracted from the plasma of untreated HIV-infected men as positive controls. N1–N2, DNA extracted from PBMCs of healthy men as negative controls; N3–N4, HIV RNA extracted from plasma of healthy men as negative controls. Figure A: 1, 3, 5, HIV DNA extracted from co-cultured PBMCs of healthy men with purified spermatozoa of HIV infections; 2, 4, 6, HIV DNA extracted from co-cultured CD8-deleted-PBMCs of healthy men with purified spermatozoa of HIV infections. Figure B: 1–6, HIV RNA extracted from the co-cultured supernatant reverse transcribed into cDNA used for nested PCR (1-6 consistent with the order in Figure A). Figure C: 1–3, HIV DNA and RNA extracted from purified spermatozoon from untreated HIV infections cultured alone. Figure E: 1–5, HIV DNA and RNA extracted from purified spermatozoon from HIV infections under ART co-cultured with CD8-deleted-PBMCs of healthy men.