Figures & data
Figure 1. Antiviral activity of rifamycins on YFV and other flaviviruses. (a) Schematic diagram of high-throughput drugs screening for anti-YFV compounds and further mechanistic study. (b) Cell viability detection of rifamycins on Huh7 cells. Anti-YFV activity of rifamycins in Huh7 cells infected with YFV-17D (MOI = 0.1) by RT-qPCR (c) and IF (d). (e) Effect of rifapentine on other flaviviruses. Huh7 cells were infected with HCV, DENV, ZIKV, JEV, or WNV (MOI = 0.1) with indicated concentrations of rifapentine or DMSO, and the infection was analysed by IF. Results were exhibited as infection rate compared to DMSO treated-group. Data were shown as mean ± SD of three independent experiments. *p < .05, **p < .01 compared to DMSO group.
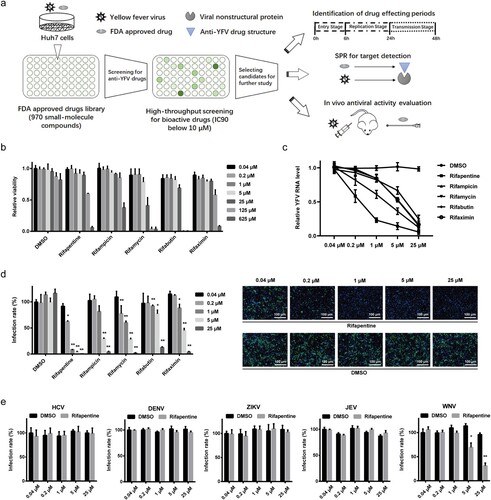
Table 1. Selective index of rifamycin antibiotics.
Figure 2. Rifapentine impaired viral binding. (a) Huh7 cells were infected with YFV-17D (MOI = 0.1) and treated with 25 μM rifapentine during different periods of viral infection. At 48 h post-infection, cells were analysed by IF. (b) Huh7 cells infected with YFV-17D were treated with rifapentine (25 μM), bafilomycin A1 (25 nM) or NH4Cl (25 mM) for 2 h during different periods as shown in the panel. At 24 h post-infection, YFV infection was assessed by IF. (c, d) Huh7 cells were incubated with YFV-17D at 4°C for 90 min with indicated concentrations of rifapentine. Part of the cells were cultured at 37°C for 24 h before being detected by IF (c). The other cells were lysed to determine the bound virus by RT-qPCR (d). (e) The virions were incubated with rifapentine (25 μM) for 6 h followed by sucrose density centrifugation to remove the compound. Viral infectivity was tested by reinfecting naïve Huh7 cells and analysed by IF. (f) Huh7 cells were incubated with labelled TF and rifapentine for 6 h before the cellular fluorescent intensity was detected. (g) Huh7 cells inoculated with YFV-17DDiD were treated with rifapentine (25 μM), Bafilomycin A1(25 nM) or NH4Cl (25 mM). Fluorescence units were collected every 15 min for total 32 cycles. Results were plotted as relative fluorescence units after subtraction of the background (uninfected culture). Data were shown as mean ± SD of three independent experiments. **p < .01 compared to DMSO group.
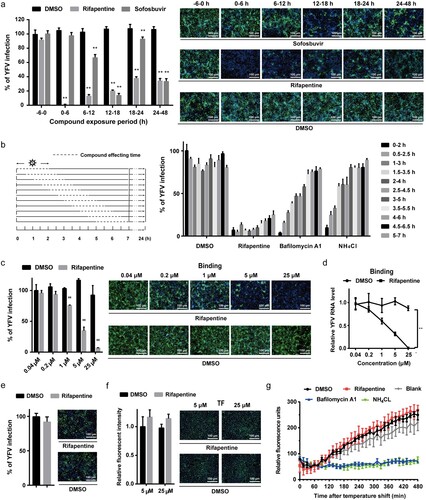
Figure 3. Rifapentine suppressed YFV replication. (a) Huh7 cells infected by YFV-17D (MOI = 0.1) were incubated with rifapentine for 24 h, and YFV RNA levels were determined by qPCR. (b) Schematic diagram of YFV replicon plasmid was shown. The transfection efficiency of various concentrations of YFV replicon RNA in Huh7 cells was detected 24 h later by measuring cellular Nano-Luc intensity. (c, d) Huh7 cells were transfected with YFV replicon RNA, and treated with rifapentine or sofosbuvir for 24 h. Cells were then detected by Nano-Luc reagent and IF assay. Results were plotted as relative ratio of grey scale or fluorescence intensity compared to DMSO-treated group. (e) Huh7 cells were transfected with YFV RNA, and treated with rifapentine. At 48 h after transfection, cells were subjected to three cycles of freeze and thaw to get the assembled virions. Supernatants were collected to assess the released virions. Results were exhibited as % of YFV infection compared to DMSO-treated group. Data were shown as mean ± SD of three independent experiments. *p < .05, **p < .01 compared to DMSO group.
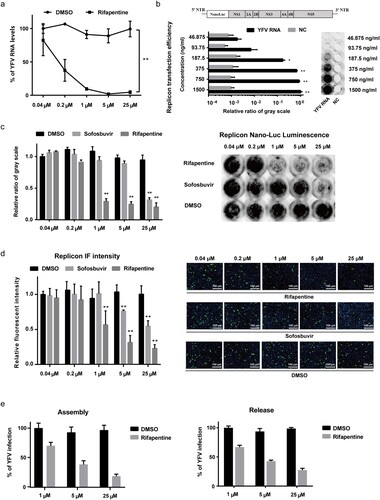
Figure 4. Rifapentine inhibited YFV replication by binding to viral RdRp domain. (a, b, c, d) SPR assay was utilized to examine the binding by BIAcore 8K system. YFV NS5 or RdRp protein was immobilized on the CM5 chip, and serial dilutions of rifapentine and sofosbuvir were detected. The KD values was analysed by Biacore 8K software. (e, f) The binding of rifapentine to YFV RdRp was simulated by computer docking. Three-dimensional ligand-interaction maps of YFV RdRp domains bound with rifapentine were generated (e). (f) Residues lining the pocket for rifapentine (incarnadine sticks) were shown as green sticks. Individual residues were labelled according to their numbering in YFV NS5 (PDB: 6qsn), hydrogen bonds were indicated with red dashed lines.
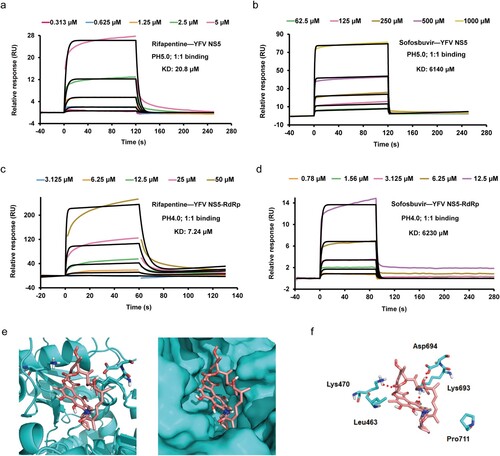
Figure 5. Antiviral activity of rifapentine in YFV-infected A129−/− mice. (a and b) 5-week A129−/− mice (n = 8) were inoculated with 100 μl WT YFV of 5 × 10⁴, 5 × 10³ or 5 × 10² PFU respectively by intraperitoneal injection. Treatment of rifapentine or sofosbuvir (20 mg/kg/day) was given daily either one day prior to (Pre-Rifapentine or Pre-Sofosbuvir) or after infection (Post-Rifapentine) until day 21 by gavage. The survival of the mice was analysed by log-rank test (a). Body weight changes (b) and clinical scores (c) were documented and calculated daily. Viral load in the serum (d) or tissues of brain (e), spleen (f), liver (g) and kidney (h) were determined by plaque formation test. Viral protein expression in the brains of infected mice was tested by IHC and IF assay (i). Pathological damage in brains of infected mice was analysed by histological section using Haematoxylin and Eosin (HE) staining (j). Data were shown as mean ± SEM. *p < .05, **p < .01 compared to DMSO group.
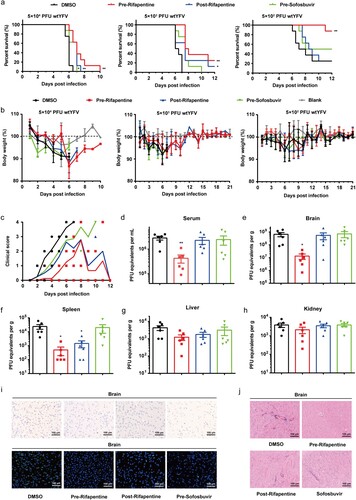
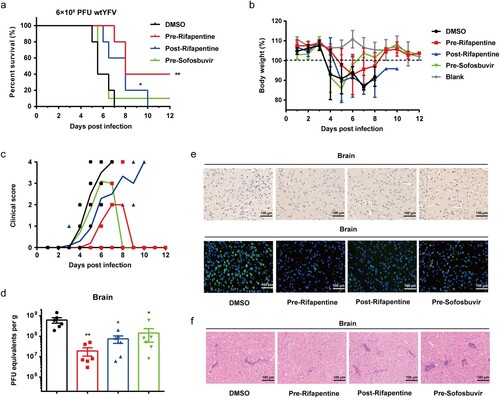
Figure 6. Antiviral activity of rifapentine in YFV-infected C57 mice. 3-week C57 mice (n = 10) were inoculated with 100 μl WT YFV of 6 × 10⁸ PFU by intraperitoneal injection. Treatment of rifapentine or sofosbuvir (20 mg/kg/day) was given daily until day 21 by gavage. The survival of mice was analysed by log-rank test (a). Changes in body weight (b) and clinical scores (c) were recorded daily. Viral load was detected in brains by plaque formation test (d). Viral protein expression in brains of infected mice was tested by IHC and IF assay (e). Pathological damage in brains was analysed using HE staining (f). Data were shown as mean ± SEM. *p < .05, **p < .01 compared to DMSO group.