Figures & data
Figure 1. Inhibition activity of Katrice-16 against K. pneumoniae ST16. (A) Representative broth inhibition assays of Katrice-16 MOI 10 and K. penumoniae ST16 over 12 h, error bars represent the SD (n = 3). For each graph, the area under curve (AUC%) was calculated based on the bacterial growth in the presence/absence of Katrice-16 MOI 10. AUC% below 50% are highlighted in red. The set with the inhibition curves of all K. pneumoniae ST16 isolates can been seen in Figure S1. (B) Violin plot demonstrating the distribution of all 56 K. pneumoniae ST16 AUC% using Katrice-16 MOI 10. The blue squares are individual values of AUC%, the red line represents the mean, and the blue lines the quartiles (Q1, Q2, and Q3). (C) Broth inhibition assays of representative isolates poorly inhibited by Katrice-16 MOI 10. During this new assay, an increased concentration of Katrice-16 was used to achieve higher MOIs (100 and 1000). The experiment was conducted over 16 h and error bars represent the SD (n = 3). D Individual AUC% values of the eight poorly inhibited isolates submitted to a new broth inhibition test using higher MOIs. Black lines represent the median for each group and p value was calculated by one-way analysis of variance (ANOVA) followed by Tukey multiple comparison post hoc test [MOI 10 vs. MOI 100, p = .1185; MOI 10 vs. MOI 1000, p = .0164; MOI 100 vs. MOI 1000, p = .6085].
![Figure 1. Inhibition activity of Katrice-16 against K. pneumoniae ST16. (A) Representative broth inhibition assays of Katrice-16 MOI 10 and K. penumoniae ST16 over 12 h, error bars represent the SD (n = 3). For each graph, the area under curve (AUC%) was calculated based on the bacterial growth in the presence/absence of Katrice-16 MOI 10. AUC% below 50% are highlighted in red. The set with the inhibition curves of all K. pneumoniae ST16 isolates can been seen in Figure S1. (B) Violin plot demonstrating the distribution of all 56 K. pneumoniae ST16 AUC% using Katrice-16 MOI 10. The blue squares are individual values of AUC%, the red line represents the mean, and the blue lines the quartiles (Q1, Q2, and Q3). (C) Broth inhibition assays of representative isolates poorly inhibited by Katrice-16 MOI 10. During this new assay, an increased concentration of Katrice-16 was used to achieve higher MOIs (100 and 1000). The experiment was conducted over 16 h and error bars represent the SD (n = 3). D Individual AUC% values of the eight poorly inhibited isolates submitted to a new broth inhibition test using higher MOIs. Black lines represent the median for each group and p value was calculated by one-way analysis of variance (ANOVA) followed by Tukey multiple comparison post hoc test [MOI 10 vs. MOI 100, p = .1185; MOI 10 vs. MOI 1000, p = .0164; MOI 100 vs. MOI 1000, p = .6085].](/cms/asset/21ca2452-52c5-4ed4-8793-4b7c8f0afc2f/temi_a_2051752_f0001_oc.jpg)
Figure 2. In vivo efficacy of Katrice-16 demonstrated by Kaplan–Meier plots showing the percent of G. mellonella survival after phage cocktail treatment. P values were calculated using Log-rank (Mantel-Cox) test for (A) (107 PFU/mL, p = .3114, χ² = 1.025, d.f = 1; 10⁸ PFU/mL, p = .0027, χ² = 8.997, d.f = 1), (B) (10⁷ PFU/mL, p < .0001, χ² = 15.43, d.f = 1; 10⁸ PFU/mL, p = .0032, χ² = 8.716, d.f = 1), (C) (10⁷ PFU/mL, p < .0001, χ² = 53.76, d.f = 1; 10⁸ PFU/mL, p < .0001, χ² = 50.90, d.f = 1), (D) (10⁷ PFU/mL, p < .0001, χ² = 33.05, d.f = 1; 10⁸ PFU/mL, p < .0001, χ² = 51.40, d.f = 1), (E) (10⁷ PFU/mL, p < .0001, χ² = 33.91, d.f = 1; 10⁸ PFU/mL, p < .0001, χ² = 46.54, d.f = 1), (F) (10⁷ PFU/mL, p < .0001, χ² = 26.34, d.f = 1; 10⁸ PFU/mL, p < .0001, χ² = 56.86, d.f = 1). *indicates .01 < p value < .05, **indicates .001 < p value < .01, ***indicates .0001 < p value < .001, ****indicates p value < .0001.
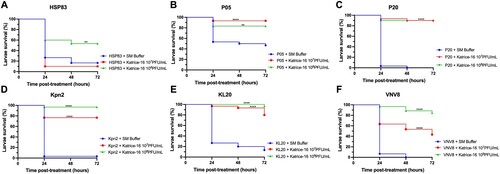
Figure 3. Synergism activity between Katrice-16 and meropenem against three carbapenemase-producing K. pneumoniae ST16 isolates. Synograms were constructed based on the data of bacterial growth in the presence/absence of antibiotic and phages over 10 and 20 h. Dashed red lines represent the susceptibility breakpoint of meropenem according to EUCAST, 2021. KL29 synograms from 10 h (A), and 20 h (B) followed by a set of four selected growth curves (C), demonstrating the effect of different concentrations of meropenem and Katrice-16 in the bacteria growth. BKBR synograms from 10 h (D), and 20 h (E) followed by a set of four selected growth curves (F), demonstrating the effect of different concentrations of meropenem and Katrice-16 in the bacteria growth. P31 synograms from 10 h (G), and 20 h (H) followed by a set of four selected growth curves (I), demonstrating the effect of different concentrations of meropenem and Katrice-16 in the bacterial growth.
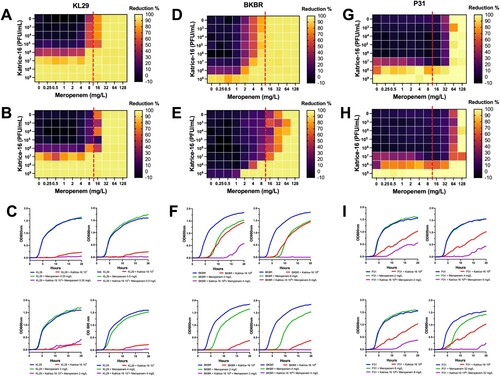
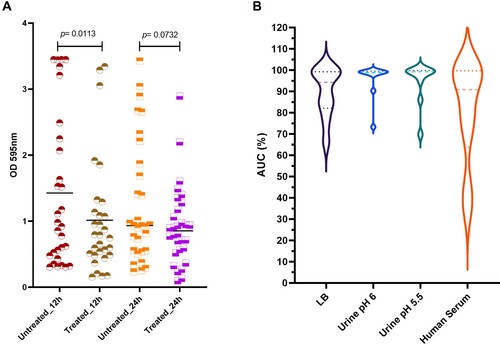
Figure 4. Katrice-16 antibiofilm activity and its performance in human body fluids. (A) Biofilm production of 30 K. pneumoniae ST16 isolates with and without treatment (12 and 24 h). Black horizontal lines represent the median of each group and p value was calculated by Wilcoxon signed-ranks test (12 h, p = .0113; 24 h, p = .0732). (B) Katrice-16 activity demonstrated by AUC% values of 10 selected K. pneumoniae ST16 in Lysogeny Broth (LB) and human body fluids (urine and human serum). Violin plots’ internal lines represent median and quartiles, and p values were calculated using non-parametric one-way ANOVA (Tukey’s multiple comparisons tests).