Figures & data
Figure 1. Functional analysis of MCA-2 during parasite (asexual and sexual) development. Mice were infected with P. berghei wild or ΔPbMCA-2 parasite, and parasitaemia was monitored for 11 days (A). Giemsa stained bright-field microscope images were showing the predominant phenotype asexual stages of the parasite during the course of infection in the wild and ΔPbMCA-2 parasite line (B). Gametocytemia in mice infected with wild-type and ΔPbMCA-2 parasites. **P < 0.001 (Student t-test) (C). Female: male gametocyte ratios of wild and ΔPbMCA-2 parasites (D) Exflagellation of male gametocytes in the wild-type and ΔPbMCA-2 parasites; **P < 0.04 (Student’s t-test) (E). Ookinete numbers in wild and ΔPbMCA-2 parasites (F). **P < 0.002 (Student’s t-test). The error bars in B-E indicate mean ± SD (n = 10).
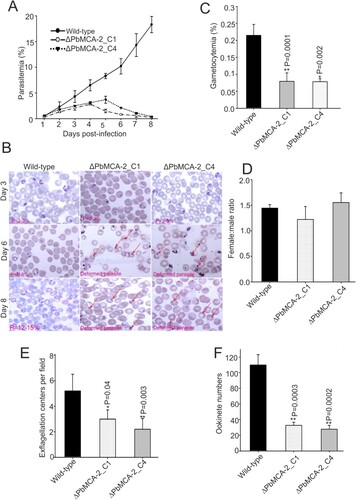
Figure 2. Functional analysis of MCA-2 during sporogonic development. Giemsa stained images of ookinete morphology in wild-type and ΔPbMCA-2 parasites (A).Graphical representation of the developmental pattern of the ookinete in wild-type and ΔPbMCA-2 parasites (B).Oocysts number per midgut in mosquitoes fed on WT and ΔPbMCA-2 parasites. **P < 0.01 (student t-test) (C). Mercurochrome stained midgut images showing oocysts numbers in the mosquito fed on WT and ΔPbMCA-2 parasites (D). Bar graph showing the quantitative difference of the oocysts and sporozoites load in the mosquito upon infection with WT and ΔPbMCA-2 parasites (E). A bar graph showing the mRNA expression of MCA-2 in the different stages (oocysts, ookinete and sporozoites) of the parasite (F) Data in the functional analysis of PbMCA-2 are representative of three independent experiments.
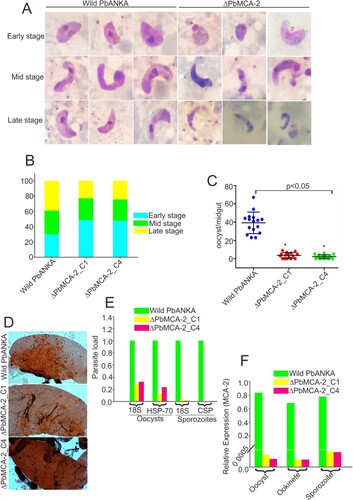
Figure 3. Effect of Artemisinin drug in the ΔPbMCA-2 parasites. Mice in each experimental group were treated with the compound Artemisinin (10 mg/kg). The per cent parasitaemia from days 3–14 shown in the figures, on day 12, the mean parasitaemia was determined to be <10% (untreated), whereas in the Artemisinin group the mean parasitaemia was >3% (A). The bar graphs represented the percentage of parasite suppression in treated groups over a period of time (B). A graph represented the survival rate of animals after drug treatment in the ΔPbMCA-2 and wild-type parasites (C).
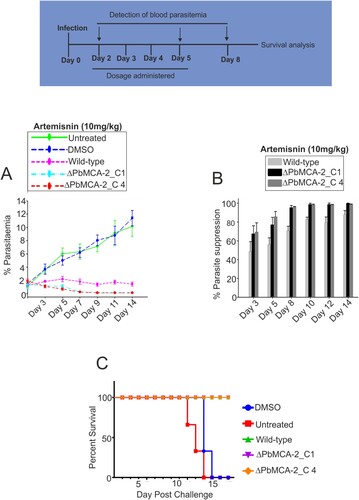
Figure 4. Enzymatic activity of PfMCA-2 in the presence of different compounds. Different compounds were tested against MCA-2. Eighteen compounds were checked at 2 µM concentration (A). Kinetic study of PfMCA-2 using different concentrations of the effective compounds, C-532 and C-533, and Ki values were calculated based on nonlinear Michaelis–Menten regression (B, C). C-532 and C-533 had no effect on the activities of well-characterized malaria proteases, MCA-3, FP-2, FP-3, VP-3 and PM-II (D). Native MCAs enzymatic activity using z-GRR-AMC substrate and inhibitory molecules, C-532 and C-533 in P. falciparum and P. berghei lysates (E) Native MCAs enzymatic activity using z-GRR-AMC substrate and inhibitory molecules, C-532 and C-533 in P. berghei wild and MCA-2 knockout parasites (F)
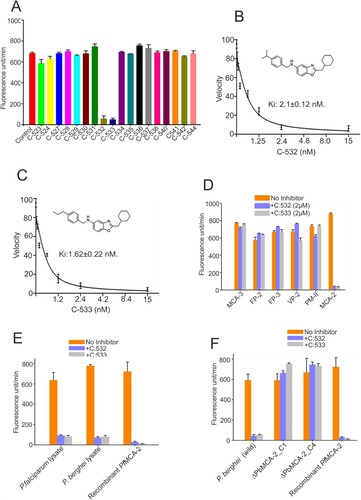
Figure 5. In vitro inhibition of P. falciparum growth at asexual and sexual stages in the presence of MCA-2 inhibitors, C-532 and C-533. Giemsa stained bright-field microscope images showed the predominant parasite phenotype at different concentrations of C-532 and C-533 after 36 hrs of incubation. Treated parasites did not progress normally at their lowest concentration of 0.6nM, and morphologically distorted rings were observed (A, B). Solid lines graphs represented the parasitaemia in the C-532, and C-533 treated parasites after staining with syber-green-I dye (C, D). Giemsa stained bright-field microscope images were showing the predominant phenotype of the gametocytes stages of the parasite at 24 and 72 hrs after the addition of compounds C-532 and C-533 (E). A graph represented the IC50 value of C-532 and C-533 for inhibiting 50% parasite growth in vitro (F).
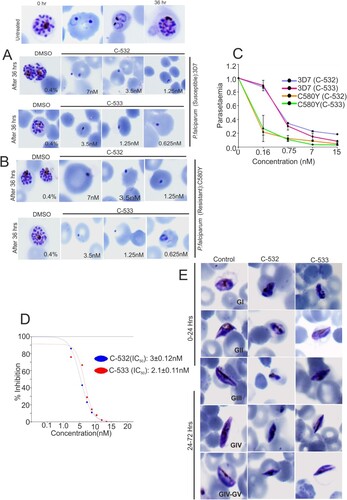
Figure 6. Effect of C-532 and C-533 on sexual cycle in-vivo and their transmission-blocking activity. The percentage cell viability was assessed in HepG2 cell line in the presence of C-532 and C-533 and their respective controls (A). The 10mg/kg of both C-532 and C-533 was injected in P. berghei infected mice. The percent gametocytemia from days 0–14 is shown in the figure. On day 14, treated groups showed significantly low parasite load compared to control (B). A bar graph depicted the percent parasite suppression in the treated groups (C). Graph showing the survival of animals after C-532 and C-533 treatment (D). The effect of C-532 and C-533 on the transmission of Plasmodium sp. in the malaria vector was assessed. The 10 nM concentrations were used for C-532 and C-533 in P. falciparum gametocyte culture and 10mg/kg in the P. berghei infected mice. Dots plot showing oocysts count per midgut in An. stephensi after feeding with P. falciparum mature gametocytes rich culture, and mice infected with P. berghei ANKA (E and F). Graph showing the P. falciparum and P. berghei infectivity in the An. stephensi by measuring 18s rRNA expression using real-time PCR (G). Mercurochrome stained midgut images showing oocysts numbers in the mosquito fed on wild parasites and treated with C-532 and C-533 (H).
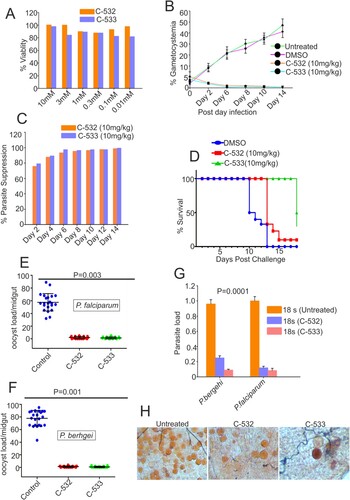
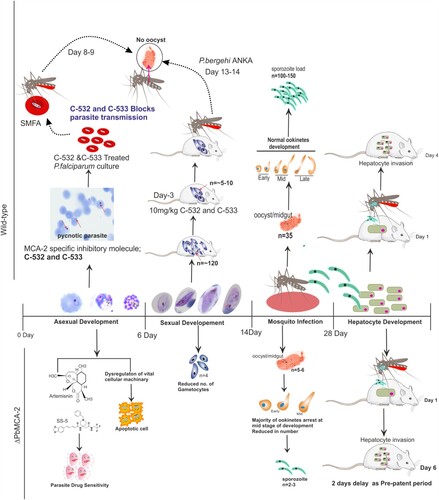
Figure 7. A summarized graphical depiction of MCA-2 function in the ΔPbMCA-2 parasites and action of potential MCA-2 specific inhibitory molecules, C-532 and C-533.