
Figures & data
Figure 1. Dynamic of SARS-CoV-2 infections and reinfections diagnosed at IHU Méditeranée Infection, 2020–2021.
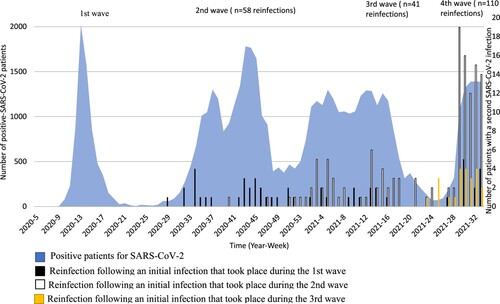
Figure 2. Prevalence of reinfection (proportion of COVID patients who sustained a previous infection with SARS-CoV-2, red curve) and estimated risk for reinfection (proportion of patient infection during a given wave of COVID-19 who got reinfected at the time of study, histograms). The prevalence of reinfection increased from 0 to 1.54% from the first to the fourth wave. The risk for reinfection decreased from 0.77 for the first wave to 0.19 for the third wave (data were not available at the time the study was done to calculate the risk for reinfection for the fourth wave).
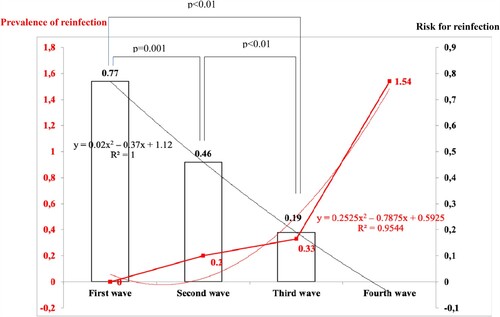
Table 1. Characteristics of the study population (N = 209).
Table 2. COVID-19 severity and SARS-CoV-2 variants in 209 reinfected patients.
Table 3. Risk factors for hospitalization among reinfected and primo-infected patients with 20I (Alpha.V1) (B.1.1.7), 20A.EU2 (B.1.160) and 21A (Delta) (B.1.617.2) (paired by age, gender, comorbidities, and variants of SARS-CoV-2) (N = 159).