
Figures & data
Figure 1. (A) Monthly respiratory virus isolation between 2010 and 2020 from central laboratory-based surveillance network established by Taiwan Centres for Disease Control (TCDC). The respiratory viral positivity rate has declined remarkably since February 2020. Influenza virus types A and B accounted for the largest proportion from 2010 to 2019. However, respiratory syncytial virus incidence exhibited an enormous increase since August 2020, even with a lower viral positivity rate. X-axis: year-month of specimen received, left Y-axis: number of isolates, right Y-axis: total viral positivity rate, dashed black line: the viral positivity rate between 2010 and 2020. (B) The top five virus isolated from respiratory tract between 2010 and 2020 (b). The most common respiratory viruses in the past ten years included influenza A and B and adenoviruses. In 2020, respiratory syncytial virus became the most common respiratory virus, replacing influenza virus and adenovirus. Data obtained from the Taiwan Centres of Disease Control. Y-axis: percentage of isolates, X axis: year.
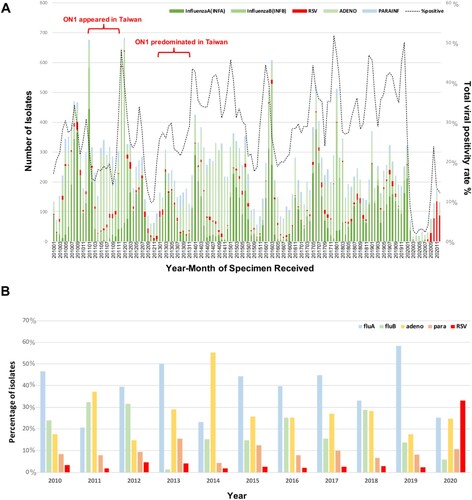
Table 1. The surveillance data for respiratory virus isolation from 2010 to 2020 and annual odds ratio of RSV, adenovirus, influenza A, B cases compared to the reference year 2010.
Figure 2. Flow chart describing cases selection. a: patients without complete medical data, children younger than 5 years old, patient with underlying disease such as prematurity, chronic lung disease, congenital heart disease, genetic metabolic disorder, nervous system disease, immune deficiency or cancer were excluded.
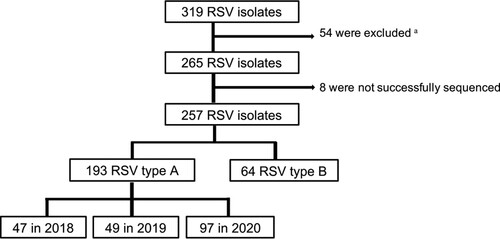
Figure 3. Phylogenetic analysis of the G gene of respiratory syncytial virus (RSV) ON1 strains circulating in Taiwan between February 2018 and January 2021 with reference strains between 2011 and 2016. The phylogenetic tree of G protein shows that ON1 samples from 2020 with amino acid substitution E257 K were clustered apart from those of the previous seasons including ON1 in 2020 without E257 K, ON1 in 2018 and 2019 in our study and reference strains between 2011 and 2016 in Taiwan. Our strains from 2020 were also apart from the reference strains ON1-1.1–ON1-1.4 from 2018 and 2019 seasons distributed in all clades. GenBank accession numbers used in this figure are listed in Table S1. Scale bar shows the number of substitutions per site.
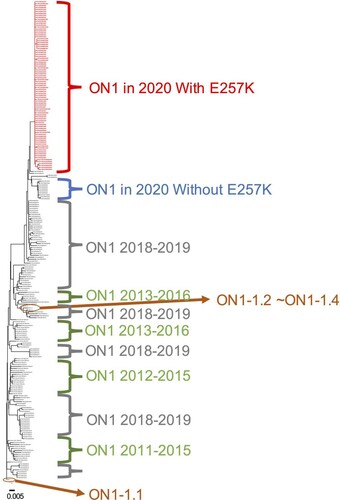
Table 2. Analysis of patients’ demographic and clinical Data in RSV positive patients grouped by RSV genotype and years.
Table 3. The univariate and multivariate analysis by logistic regression for the factors associated with O2 saturation <94%.
Supplemental Material
Download MS Word (32.4 MB)Data availability statement
The G protein and F protein sequences of RSV-A generated during this study were deposited into the GenBank database under accession number MZ417560−MZ417781 and OM801240−OM801242.