Figures & data
Figure 1. Distribution of participating hospitals comprising provincial (orange colour) and municipal hospitals (blue colour).
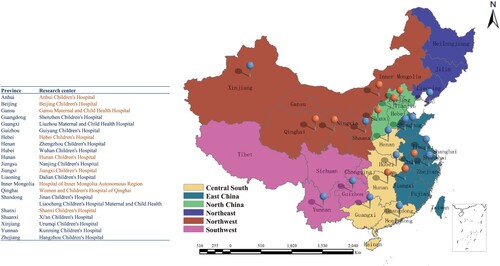
Figure 2. Distribution of pediatric TB cases among hospitals in our study.
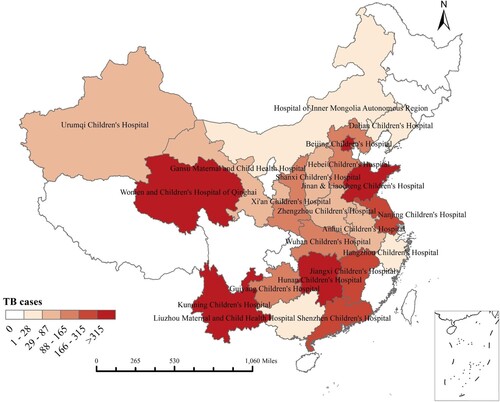
Table 1. Characteristics of EPTB and combined TB pediatric patients compared with PTB pediatric patients, China, 2015–2018.
Figure 3. EPTB disease sites among 2,130 pediatric patients in China, 2015–2018.
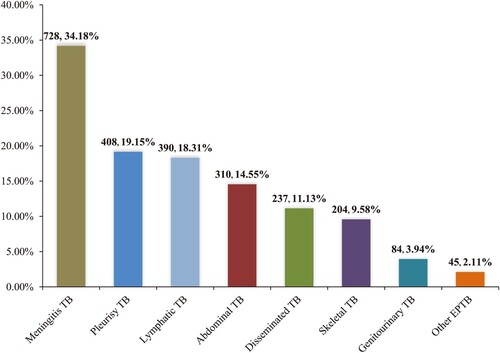
Table 2. Demographic and clinical characteristics according to forms of EPTB, China, 2015–2018.
Table 3. Multivariate analysis of associated factors for different forms of EPTB, China, 2015–2018.
Figure 4. Age distributions of PTB and forms of EPTB in China, 2015–2018.
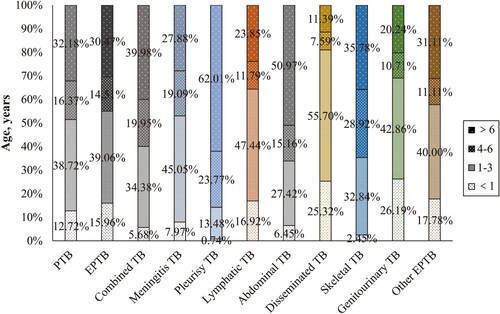
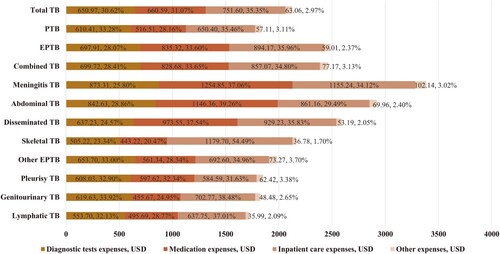
Table 4. Distribution of hospitalization expenses by different TB types, China, 2015–2018.
Figure 5. Hospitalization expenses among 4,654 pediatric patients in China, 2015–2018. A) Total hospitalization expenses of PTB and forms of EPTB. B) Out-of-pocket hospitalization expenses of PTB and forms of EPTB. C) Cost burdens of PTB and forms of EPTB. D) Catastrophic expenditures of PTB and forms of EPTB.
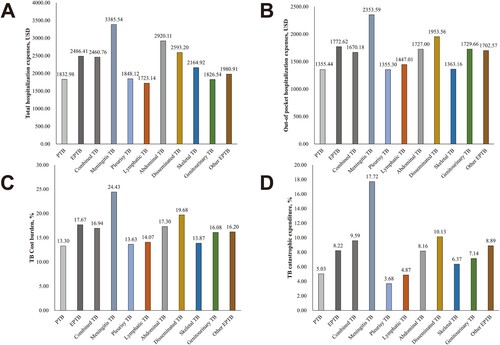
Figure 6. Expenses of PTB and forms of EPTB in China, 2015–2018.