Figures & data
Figure 1. Schematic of experimental design. Hamsters (n = 70/group) were given a primary mock or SARS-CoV-2 infection (105 TCID50 USA/WA1/2020). At 3 and 6 dpi, lung and nasal turbinates were collected (n = 4/group/time point), and weight loss was monitored in the remaining animals for 14 days. At the time of secondary challenge (1, 2, 4, or 6 months post-primary infection), 14 hamsters from each original group (SARS-CoV-2 infected or mock) were intranasally challenged with SARS-CoV-2 (105 TCID50 USA/WA1/2020). Serum samples were collected from a subset of hamsters (n = 10 infected and mock) for the duration of the study until day 168.
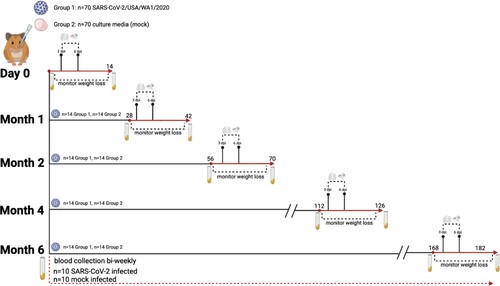
Figure 2. Primary SARS-CoV-2 infection causes weight loss and viral replication in the respiratory tract. (A) Body weight changes in hamsters after primary mock (green, n = 6) or SARS-CoV-2 infection (blue, n = 6). * denotes p≤0.01 between groups. (B) Viral titres in nasal turbinates and lungs on day 3 and 6 post-primary mock (green squares) or SARS-CoV-2 infection (blue circles) (n = 4/group/time point).
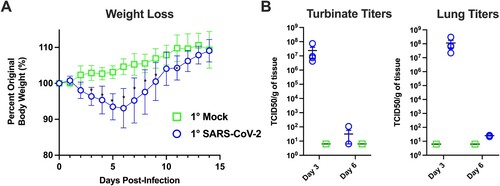
Figure 3. Primary SARS-CoV-2 infection causes lung pathology consistent with COVID-19. Shown are H & E stained lung sections imaged at 20× and 100× magnification, scale bars are 500 and 100 μm respectively. (A,B) Lungs taken from an uninfected control animal; no lesions observed in day 3 or 6 animals, only day 3 animals are displayed. (C,D) Lung, 3 days post-primary SARS-CoV-2 infection: Prominent pathological features include a mild mononuclear cell infiltrate centred around bronchioles, minimal perivascular infiltrate, bronchiolar epithelial degeneration, and alveolar oedema. (E,F) Lung, 6 days post-SARS-CoV-2 infection: Prominent features include marked type II pneumocyte hyperplasia, robust bronchiolar and interstitial mononuclear cell infiltrate, perivascular oedema, and moderate alveolar oedema. (G) Lungs were scored on the extent of lesions (0–4), alveoli (0–3), bronchi/bronchioles (0–3), blood vessels (0–3), and haemorrhage (0–2). * denotes p ≤ 0.05 between scores for each group.
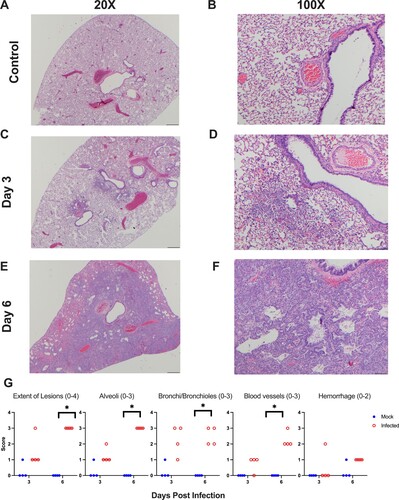
Figure 4. SARS-CoV-2 infected hamsters maintain antibodies against SARS-CoV-2 for 6 months post-infection. Assessment of the binding antibody response from day 0 to 168 in SARS-CoV-2 infected hamsters by ELISA (n = 10/time point). Serum levels of (A) IgG and (B) IgA binding antibodies, and (C) fold change of serum levels of IgG and IgA antibodies against the RBD from SARS-CoV-2 infected hamsters. Serum levels of (D) IgG and (E) IgA antibodies, and (F) fold change of serum levels of IgG and IgA antibodies against the S protein from infected hamsters. Serum levels of (G) IgG and (H) IgA antibodies, and (I) fold change of serum levels of IgG and IgA antibodies against the N protein from infected hamsters. (J,K) Neutralizing antibody titres in serum collected from SARS-CoV-2 infected animals between days 0 and 168 (n = 10).
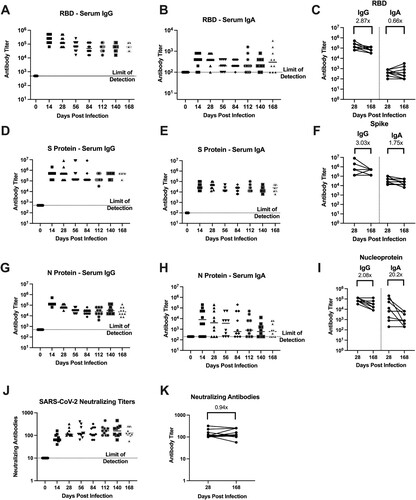
Figure 5. Hamsters are protected from weight loss upon re-challenge with SARS-CoV-2. Body weight changes in hamsters after challenge at designated time points (panels A–D) after the primary infection in previously mock-infected hamsters challenged with SARS-CoV-2 (red, n = 6) compared to previously SARS-CoV-2 infected animals given a secondary SARS-CoV-2 infection (blue, n = 6). * denotes p ≤ 0.01 between groups. Panels (E,F) show viral titres in nasal turbinate and lung samples in animals (n = 4/group/time point) given a primary mock infection followed by a SARS-CoV-2 infection (red squares) and from animals given a primary SARS-CoV-2 infection and then re-challenged with SARS-CoV-2 (blue circles). Breakthrough infection was observed in one hamster denoted by * following the 4-month secondary infection.
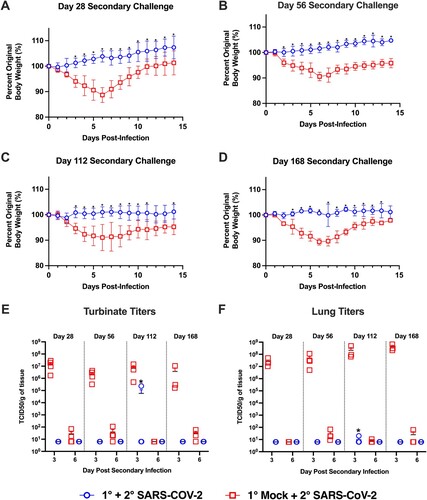
Figure 6. IgG and IgA binding and neutralizing antibody titres in the 4-month secondary challenge group. Prior to secondary virus challenge, blood samples were collected from all animals to evaluate the antibody response in the event of a breakthrough infection. Shown are antibody titres in previously SARS-CoV-2 infected animals given a secondary SARS-CoV-2 infection at 4 months post-primary infection. One animal denoted by the red symbol developed a breakthrough infection. Antibody titres against the RBD and S proteins by (A) IgG and (B) IgA ELISA, and (C) neutralizing titres determined via microneutralization assay.
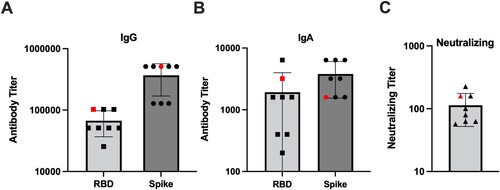
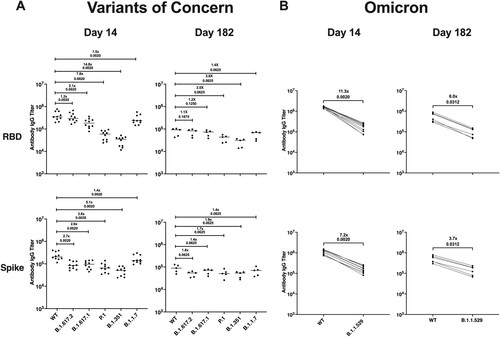
Figure 7. Infection with SARS-CoV-2/USA/WA1 induces a durable and cross-reactive antibody response against variants of concern. Serum samples collected on 14 (n = 10) and 182 dpi (n = 6) from an additional group of hamsters given a primary SARS-CoV-2 infection were used in a multiplex immunoassay. (A) Antibody binding and fold change against the RBD and S protein for both the Wuhan-1 (WT) and VOCs including B.1.617.2, B.1.617.1, P.1, B.1.351, and B.1.1.7. (B) Antibody binding and fold change against the RBD and S protein for Wuhan-1 (WT) and B.1.1.529. Non-parametric pairwise analysis for RBD and S specific IgG titres were performed by Wilcoxon matched-pairs signed-rank test. p-values are displayed below the fold-change value.