
Figures & data
Table 1. Clinical characteristics and laboratory findings in patients with COVID-19.
Table 2. Results of the oral glucose tolerance test in patients with COVID-19.
Figure 1. Distribution of normal glucose tolerance, prediabetes and diabetes after COVID-19. (A) Distribution of patients with COVID-19 into normal glucose tolerance (NGT), prediabetes or diabetes mellitus (DM) groups. During the OGTT, the peak time distributions of blood glucose (B) and C-peptide (C) in the mild-moderate group and the severe-critical group were analyzed. (D) OGTT results of 2 representative patients with COVID-19 and new-onset diabetes. In patient #29, C-peptide (black curve, right axis, ng/ml) was released in response to the elevation of blood glucose levels (red curve, left axis, mmol/L). In patient #42, the blood glucose level was increased, but the C-peptide level was very low throughout the entire test.
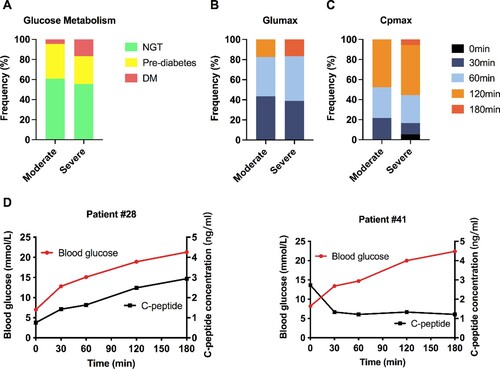
Figure 2. Opal immunofluorescence staining of SARS-CoV-2 receptors in pancreatic samples. The SARS-CoV-2 receptors ACE2 (pseudo-yellow), CD147 (pseudo-magenta), neuropilin-1 (pseudo-red), and TMPRSS2 (pseudo-white) and the pancreatic β cell maker NKX6.1a (pseudo-green) were detected in the pancreatic samples. Scale bar, 50 μm.
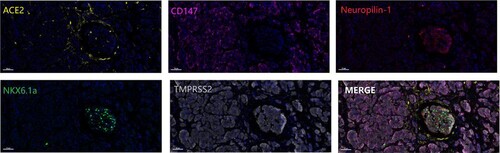
Figure 3. SARS-CoV-2 in the pancreas of COVID-19 patients. (A-B) SARS-CoV-2 receptors ACE2 and CD147 were diffusely expressed in the pancreas. In the non-COVID-19 control patient, ACE2 expression was higher in the exocrine gland, and CD147 was evenly expressed. In patients with COVID-19, ACE2 and CD147 expression was much higher in the endocrine gland. (C) SARS-CoV-2 spike antibody staining showed diffuse positive signals (brown) in the sample from the patient with COVID-19 but not in the non-COVID-19 control. (D) The SARS-CoV-2 nucleic acid probe showed positive staining (red particles) in the cytoplasm of pancreatic cells of a patient with COVID-19 but not in that of the non-COVID-19 control.
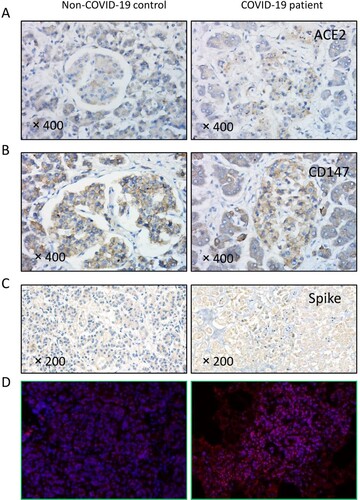
Figure 4. Transmission electron microscopic examination of pancreatic samples. Black solid triangles (▴) indicate cell membrane rupture. Red solid triangles (▴) indicate virus-like particles in the autophagolysosome (ASS). M, mitochondria; N, nucleus; Nu, nucleoli; RER, rough endoplasmic reticulum; SG, secretory granules.
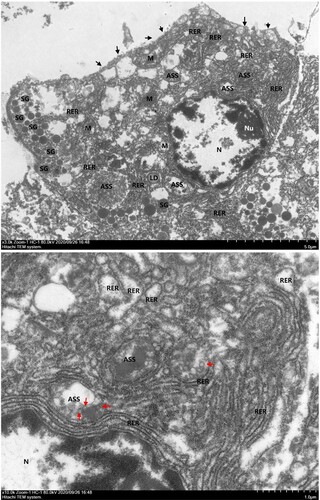
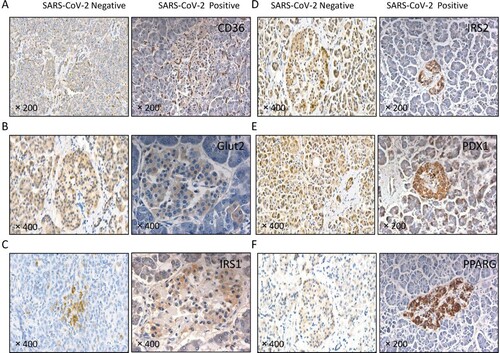
Figure 5. The expression of islet function-related molecules was altered in patients with COVID-19. Immunochemical staining using antibodies against (A) CD36, (B) GLUT2, (C) IRS1, (D) IRS2, (E) PDX1 and (F) PPARG. In the patient with COVID-19 but without SARS-CoV-2 virus in the pancreas (SARS-CoV-2 negative), CD36, GLUT2, IRS2 and PDX1 were widely distributed in the pancreatic serous acinus, the duct (exocrine gland) and the islet (endocrine gland); PPARG was mainly in the islet; and IRS1 was barely detected. In the patient with COVID-19 accompanied by SARS-CoV-2 virus in the pancreas (SARS-CoV-2 positive), CD36, GLUT2, IRS1, IRS2, PDX1 and PPARG were mainly detected in the islets. CD36 was also present in the small vasculature of pancreatic interstitial tissue.
Data availability
The data that support the findings of this study are available from the corresponding author upon reasonable request.