Figures & data
Figure 1. SARS-CoV-2 pseudovirus enters the host cells through CD147-mediated endocytosis. (A–C) Left, the knockdown or knockout of CD147 in Vero E6 and Huh-7 cells was detected by RT-PCR (**P < 0.01, ***P < 0.001). Right, SARS-CoV-2 pseudovirus infection in different cells was performed by the luciferase reporter assay (*P < 0.05, ***P < 0.001). (D, E) Left, Rab5a knockdown in Vero E6 and Huh-7 cells was detected by RT-PCR (*P < 0.05, ***P < 0.001). Right, SARS-CoV-2 pseudovirus infection in siRab5a cells and the control cells was performed by luciferase reporter assay (*P < 0.05, **P < 0.01). (F) The co-localization between Rab5a (red) and CD147 (white) was analyzed in Vero E6 cells by immunofluorescence staining. Scale bars, 25 μm. (G, H) Relative Rab5a mRNA level was detected by RT-PCR in the control and Vero E6-CD147KO or Huh-7-siCD147 cells (**P < 0.01, ***P < 0.001). (I, J) The co-localization of spike protein (green), Rab5a (red), and CD147 (white) were analyzed in Vero E6 cells and CD147 silencing cells by multicolour immunofluorescence staining. Scale bars, 25 μm.
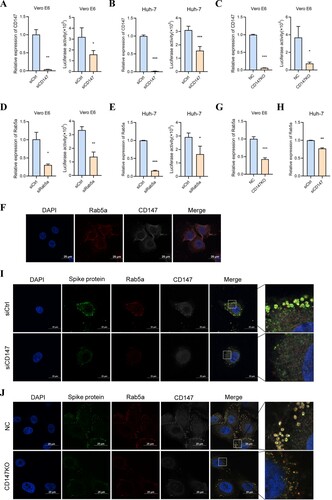
Figure 2. The screening for appropriate concentrations of different inhibitors. (A) Cell cytotoxicity was detected under different concentrations of inhibitors by the CCK-8 assay (*P < 0.05, **P < 0.01, ***P < 0.001, ns, not significant). (B) The blocking effect of EIPA (30 μM) on dextran, CPZ (25 μM) on transferrin, and MCD (3 mM) or filipin III (1 μg/ml) on CTB was observed in Vero E6 cells. Hoechst was used to stain the nuclei. Scale bars, 200 μm. (C) Phalloidin was used to evaluate the effect of cyto D (300 nM) on disrupting actin polymerization. Scale bars, 50 μm.
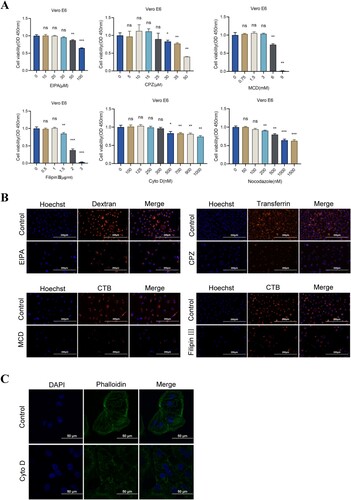
Figure 3. SARS-CoV-2 pseudovirus enters the host cells through spike protein-CD147 in an Arf6-dependent manner. (A) Vero E6 cells were pretreated with six inhibitors, respectively, for 24 h, and incubated with SARS-CoV-2 pseudovirus. The SARS-CoV-2 pseudovirus infection in the different groups was detected by the luciferase reporter assay (*P < 0.05, **P < 0.01, ***P < 0.001, ns, not significant). (B) Vero E6-CD147KO cells were pretreated with four inhibitors (MCD, filipin III, cyto D, and nocodazole) respectively for 24 h, and incubated with SARS-CoV-2 pseudovirus. The SARS-CoV-2 pseudovirus infection in the different groups was detected by the luciferase reporter assay (*P < 0.05, **P < 0.01). (C-E) Left, the knockdown of Arf6 in Vero E6, Huh-7, and Vero E6-CD147KO cells was detected by RT-PCR (***P < 0.001). Right, SARS-CoV-2 pseudovirus infection in different cells was performed by the luciferase reporter assay (**P < 0.01, ns, not significant).
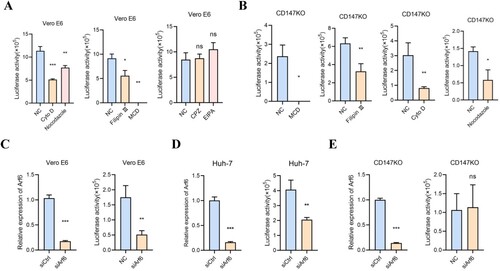
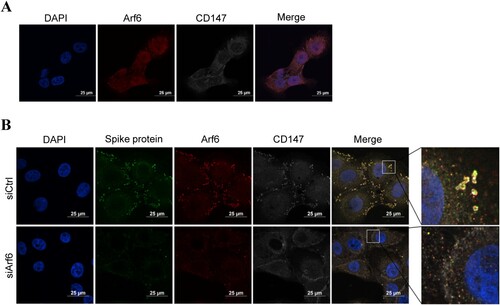
Figure 4. The co-localization of targeted proteins was observed by immunofluorescence staining. (A) The co-localization between Arf6 (red) and CD147 (white) was analyzed in Vero E6 cells by immunofluorescence staining. Scale bars, 25 μm. (B) The co-localization of spike protein (green), Arf6 (red), and CD147 (white) was analyzed in Vero E6 cells and Arf6 knockdown cells by multicolour immunofluorescence staining. Scale bars, 25 μm.