Figures & data
Figure 1. Transcriptional response to ZF2001 and the RRV vaccination. (A) Overview of transcriptional analysis. (B) DEG numbers of each immunization group are indicated (DEG versus baseline at 0 h; absolute |log2 (fold change)| >0.585; Q value <0.05, is presented.). Three mice are included in each group.
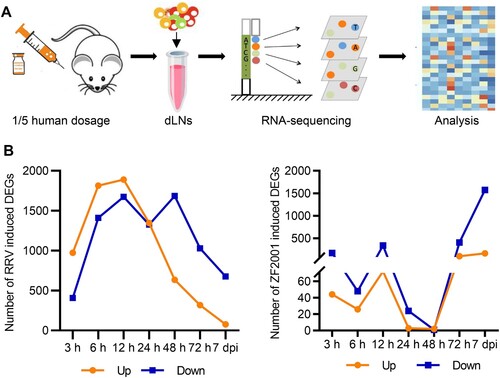
Figure 2. Innate immune response signatures of ZF2001 and the RRV vaccination. (A) and (B) Enrichment of the immune-annotated DEGs (up-regulated) from the RRV (A) or ZF2001 (B) vaccination group, ranked by correlation with each function annotation. Top ten annotations are listed. Q value <0.05. (C) Heatmap analysis indicated the responses of genes involved in the innate immune response signalling pathway. Average FPKM values are displayed after the z-score normalization. The arrow indicates the direction of the z-score.
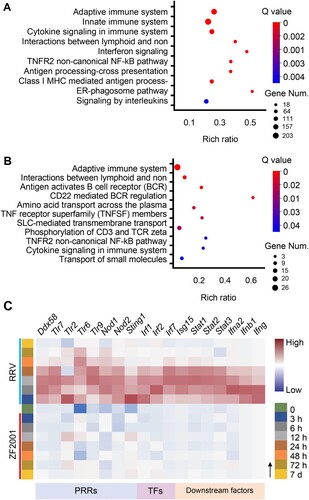
Figure 3. Adaptive immune signatures of ZF2001 or the RRV vaccination. (A) Heatmap analysis indicates the expression levels of genes involved in adaptive immunity. Average FPKM values are displayed after the z-score normalization. The arrow indicates the direction of the z-score. (B) The SARS-CoV-2 S protein-specific IgG antibody titre is determined using an enzyme-linked immunosorbent assay (ELISA). (C) NAb levels are measured with pseudovirus. (B) and (C) 5-to-6-week-old female Balb/c mice are immunized with 1/5th of the human dosage of ZF2001 or RRV. The serum is collected after priming for three weeks. Each symbol represents an individual mouse. n = 10 mice per group. ns, nonsignificant, by a two-tailed student’s t-test. (D) Venn diagram of up-regulated DEGs, which enriched the immune system after the ZF2001 or RRV immunization, along with those induced at day 7. The Venn diagram is plotted by https://www.bioinformatics.com.cn.
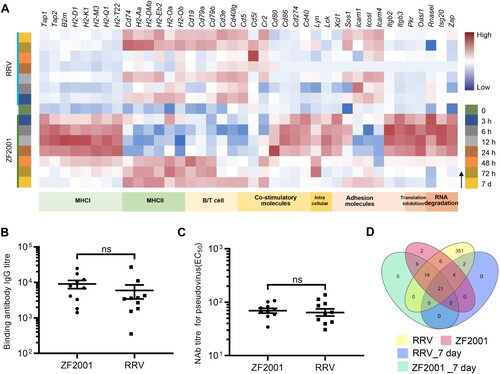
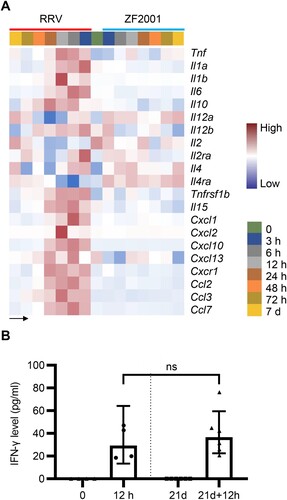
Figure 4. Cytokines levels after ZF2001 or the RRV vaccination. (A) Heatmap analysis indicates the expression levels of cytokine-encoding genes. Average FPKM values are displayed after the z-score normalization. The arrow indicates the direction of the z-score. (B) The quantitative ELISA assay is performed to measure the concentration of IFN-γ level in the serum of 5-to-6 weeks old female Balb/c mice after the RRV vaccination for an indicated time. n ≥ 4 mice per group. ns, nonsignificant, by the two-tailed student’s t-test.