
Figures & data
Figure 1. Flow chart of literature review. *Other test assays included RFLP (restriction fragment length polymorphism) and MLSA (multilocus sequence analysis).
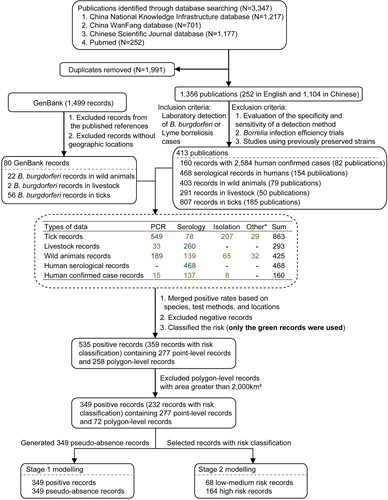
Figure 2. Distribution of Lyme borreliosis cases and the positive rate of Borrelia burgdorferi sensu lato. The quartiles of each type of data were used to truncate the corresponding data. (A) Distribution of confirmed cases of Lyme borreliosis. (B) Distribution of infection rate of specific antibody for Borrelia burgdorferi sensu lato in humans. (C) Distribution of detection rate for Borrelia burgdorferi sensu lato in wild animals. (D) Distribution of infection rate of specific antibody for Borrelia burgdorferi sensu lato in livestock. (E) Distribution of detection rate for Borrelia burgdorferi sensu lato in ticks. (F) Genospecies distribution of Borrelia burgdorferi sensu lato in China. Records reported at the province level were represented as a triangle, while records reported at the point, county, city-level were represented as a circle. *Positive rate was not calculated for the data with the number of samples tested less than 10. #Other test assays included serological method, isolation, RFLP, and MLSA. †Other test assays included PCR. ‡It has been isolated from patients.

Table 1. Demographic characteristics and clinical manifestations of Lyme borreliosis cases, 1986–2020, China
Figure 3. Distribution of the positive rate of Borrelia burgdorferi sensu lato detected in different tick species in China during 1986–2020. The quartiles of PCR positive rate in ticks were used to truncate the data. (A) Ixodes (I.). (B) Haemaphysalis (Ha.). (C) Dermacentor (D.). (D) Hyalomma (Hy.) and Rhipicephalus (R.). *The blue, red, and green asterisks represent I. crenulatus, I. kuntzi and Ha. nepalensis, respectively, and their positive rates were not calculated because the number of samples tested was less than 10.
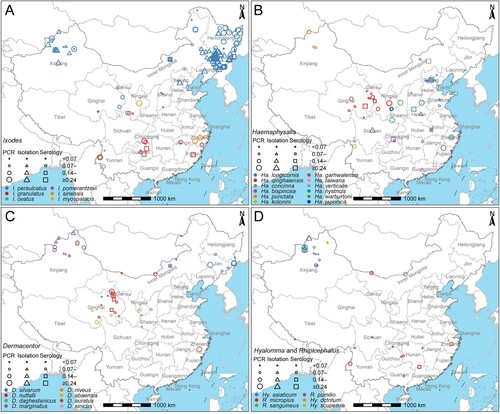
Figure 4. Recorded and predicted risk distribution of Borrelia burgdorferi sensu lato presence in China. (A) Borrelia burgdorferi sensu lato risk classification based on literature review. Background points sampled from the grid map based on distribution of positive records. The coordinates of polygon centroids were displayed for city-level or county-level evidence. (B) Predicted risk distribution of Borrelia burgdorferi sensu lato after averaged 100 bootstrapping BRT models. The thresholds of stage 1 and stage 2 model was determined by the cut-off values at which the Youden index of the test set was maximum. Black Doted Circles represent different high-risk hotspot areas. I = Northeast region, II = North China region, III = Inner Mongolia-Xinjiang region, IV = Qinghai-Tibet region, V = Southwest region, VI = Central China region, and VII = South China region.
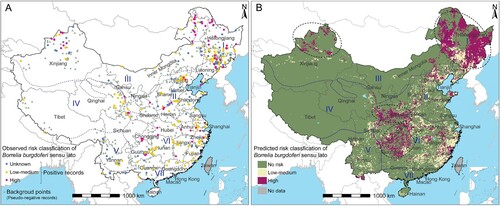
Table 2. The area and population size of the Borrelia burgdorferi sensu lato occurrence risk predicted by the BRT model.
Table 3. The relative contribution of environmental variables to predict the occurrence risk of Borrelia burgdorferi sensu lato based on BRT model.
Supplemental Material
Download MS Word (5 MB)Data availability statement
The datasets used and/or analyzed during the current study are available from the corresponding author on reasonable request.