Figures & data
Figure 1. MCR-1 confers an outer membrane permeability defect. (A–C) Growth curves of BW25113 carrying empty vector or expressing MCR-1 (A); BW25113 carrying IncX4 and BW25113 carrying IncX4 Δmcr-1 (B); BW25113 carrying IncHI2 and BW25113 carrying IncHI2 Δmcr-1 (C). The y-axes show optical densities at 600 nm (OD600) of broth cultures; x-axes show period of growth (hours). (D) Efficiency of plating assays on LB agar plates containing 1% SDS and 1 mM EDTA. Ten-fold dilutions of cultures are indicated above the left plate. (E) Efficiency of plating assays on LB agar plates with 120 μg/mL vancomycin. Ten-fold dilutions of cultures are indicated above the left plate. MCR-1-expressing cells exhibited increased sensitivity to vancomycin. (F) Checkerboard broth microdilution assays showing dose-dependent potentiation of SDS/EDTA by vancomycin against Vector cells (upper) and MCR-1-expressing cells (down). Dark blue regions represent higher cell density. (G) Serial dilutions of the indicated strains were spotted onto LB agar plates or LB agar plates supplemented with SDS. Klebsiella pneumonia strains spotted on agar plates were grown at 37°C.
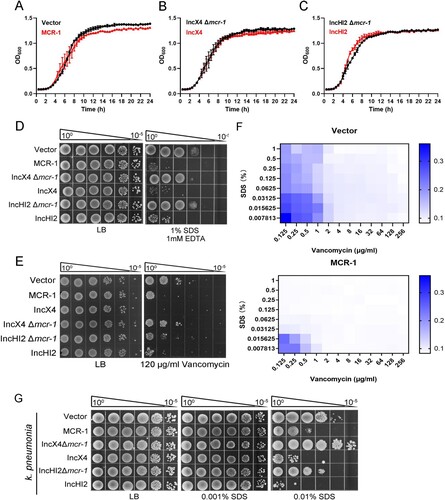
Figure 2. MCR-1 triggers bacterial shrinkage and cell death. (A) Bright-field images of BW25113 carrying empty vector or BW25113 expressing MCR-1 showing morphology variant were induced during the stationary phase (>200 cells for each group). (B) Scatterplots of cell length in Vector cells (black) or MCR-1-expressing cells (red) at the indicated time points. Middle lines represent median values. (C) SEM micrographs of BW25113 carrying empty vector (left) or BW25113 carrying pACYC-NP-mcr-1 (right). Bacterial samples were collected for imaging after 4 days in the stationary phase. (D) Fluorescent images of cells displaying protein aggresomes after they were induced in the stationary phase. Protein aggregates were labelled with IbpA-TC-FlAsH. At the indicated culture times, the cells were stained with FlAsH and washed with PBS before imaging. (E) Percentages of cells with IbpA-TC-FlAsH foci at the indicated times. (F) Percentage of dead cells was evaluated with flow cytometry. The cells were stained with PI after the indicated times in culture and washed with PBS before flow cytometry. (G) Experimental schema for testing the ability of cells to recover. Log-phase cells were cultured in LB broth for 2 days (upper) or 4 days (lower), and the bacterial cultures were then supplemented with increasing concentrations of glucose. The bacteria were photographed after supplementation for 12 h. (H) Scatterplots of cell lengths in Vector cells (black) and MCR-1-expressing cells (red) at the indicated time points. Middle lines represent median values (n = 3 biological replicates per group; data are means ± SEM, assessed with two-way ANOVA and Tukey’s multiple comparison test; ***p < 0.001, ****p < 0.0001 compared with the Vector group; ns, no significance).
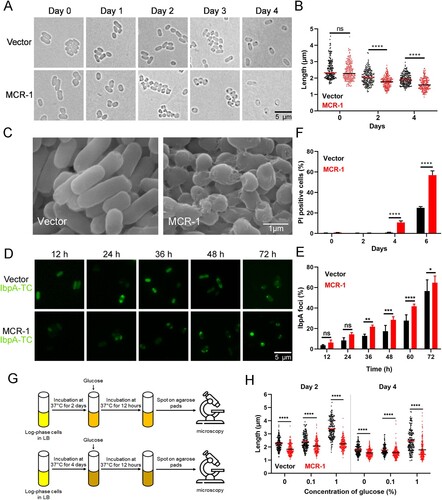
Figure 3. MCR-1 with catalytic domain deletion failed to rescue OM permeability defect and cell death (A) Super-resolution images of BW25113 carrying MCR-1-sfGFP, illustrating that MCR-1 is evenly distributed on the cell membrane. (B) Heat maps showing the upregulated expression of genes associated with stress response were upregulated in MCR-1-expressing cells. (C) Scheme of the two mutants of MCR-1 (E246A and PelBss–PEA). E246A, a mutant of MCR-1 without catalytic activity; PelBss–PEA combines the PelB signal peptide and the catalytic domain of MCR-1 (PEA). (D) Neither of the two mutants (E246A nor PelBss–PEA) conferred resistance to colistin. (E) Percentage of dead cells was evaluated with flow cytometry. After the indicated times in culture, the cells were stained with PI and washed with PBS before flow cytometry (n = 3 biological replicates per group, data are means ± SEM, assessed with two-way ANOVA and Tukey’s multiple comparison test; ****p < 0.0001 compared with Vector group). (F) Serial dilutions of the indicated strains were spotted onto LB agar plates or LB agar plates supplemented with SDS/EDTA. The bacteria were then grown at 37°C.
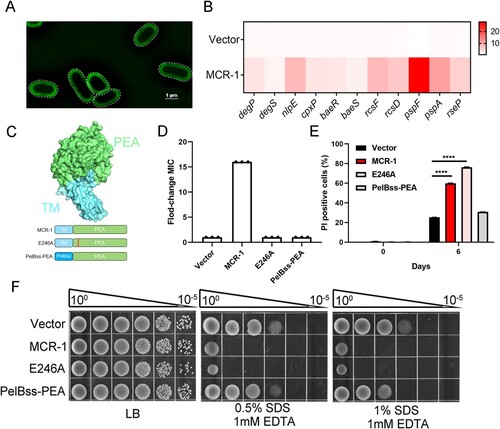
Figure 4. Potential lipid-A-binding pocket in MCR-1 is responsible for increased OM permeability and cell death. (A) Conservation analysis of 103 MCR family proteins; surface and cartoon representations. Three conserved residues in the potential lipid-A-binding pocket are labelled. (B) Functional assay of three mutations in MCR-1 essential for colistin resistance. A representative result from three independent experiments is shown. (C) Serial dilutions of the indicated strains were spotted onto LB agar plates or LB agar plates supplemented with SDS/EDTA. The bacteria were then grown at 37°C.
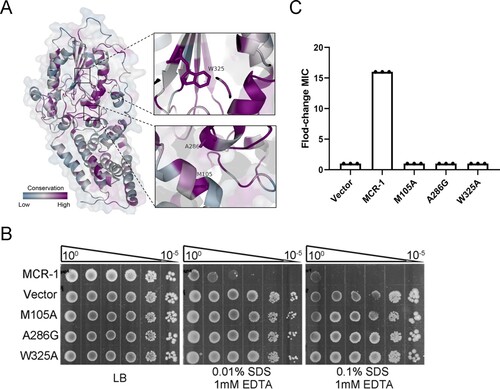
Figure 5. MCR-1-induced lipid remodelling contributes to OM permeability defects. (A) LpxC and PbgAHA proteins in whole-cell lysates of stationary-phase cells were measured with western blotting using anti-LpxC and anti-HA antibodies, respectively. RNA polymerase subunit beta (RpoB) was used as the loading control. (B) Serial dilutions of the indicated strains were spotted onto LB agar plates or LB agar plates supplemented with SDS/EDTA in the presence or absence of arabinose. The bacteria were then grown at 37°C. (C) Model of how MCR-1 controls the outer membrane permeability defect. In the stationary-phase cells, accumulated periplasmic LPS tends to bind to the PbgA–LapB complex, which promotes the degradation of LpxC by FtsH. (D) Illustration of the MCR-1-mediated phenotype during stationary phase.
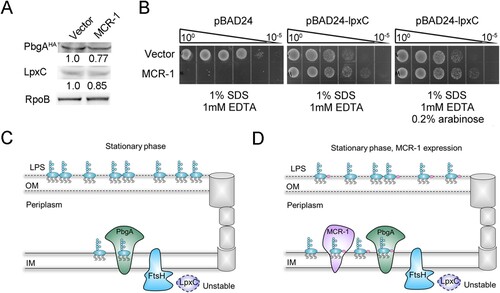
Figure 6. Model summarizing the mechanism underlying the survival and regrowth of mcr-1-positive bacteria in the stationary phase. We propose that mcr-1-positive bacteria, with increased OM permeability, exhibited reduced viability during stationary phase. Unlike mcr-1-negative bacteria, the ability of the cells to recover from stationary phase under improved conditions was also reduced, which may arise from the irreversible damage caused by MCR-1.