
Figures & data
Figure 1. General settings of infection experiments in mallards using two infected “seeder” ducks (light colour), eight contact mallards (dark colour) and two different sources of water (a) bell drinker versus and (b) pool. Seeder ducks of (a) received LP H4N6 while those of (b) were inoculated with HP H5N8. Setting (c) provides artificially contaminated pool water to four ducks as a source of infection and (d) uses a non-infected “seeder” duck with virus-contaminated plumage as contact to eight contact mallards. Created with BioRender.com. An observation time line is indicated at the top; I – Inoculation of two seeder ducks (a, b) B – blood sample, S – Swab sample (oropharyngeal, cloacal, plumage), F – Feather sample (secondary flight feather); red circled dots indicate presence of virus in water (c) or adhering to plumage (d).
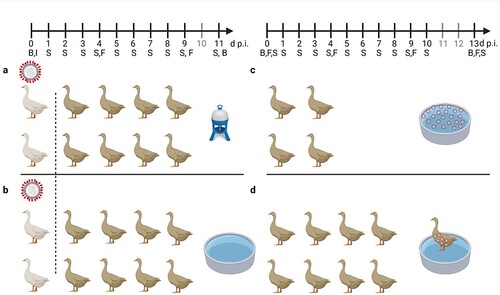
Figure 2. Seroconversion at the beginning and at the end of the observation period (11 or 13 dpi, respectively) against AIV nucleoprotein as measured by blocking ELISA in inoculated (black squares) and naïve (open circles) mallards exposed to LPAIV H4N6 (LP) or HPAIV H5N8 (HP) via inoculated “seeder” ducks (a) or via pool water (b) artificially loaded with HPAIV H5N8 at 100, 1000 or 10,000 TCID50 L−1. The dotted line represents the ELISA threshold. % inhibition indicates the blocking efficacy of mallard sera.
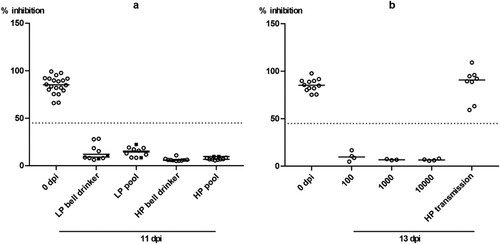
Figure 4. Dynamics of influenza A virus infection of four naïve mallards each exposed to artificially pool water containing 102, 103 or 104 TCID50 L−1 of HPAIV H5N8. (1) Qualitative results; percentage of mallards excreting viral RNA orally, cloacally, and of RNA adhering to the breast plumage (percentage RT-qPCRs-positive mallards per group) are shown. (2) Quantitative results of viral RNA excretion compared between exposure groups 102 (open circle), 103 (filled circle), and 104 (open triangle) in (a) oral, (b) cloacal and (c) plumage swabs.
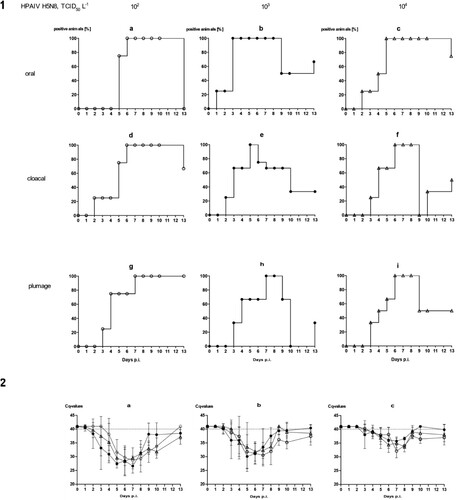
Table 1. Detection of viral infectivity in selected RT-qPCR-positive plumage swab samples obtained from mallards in experiments 1 and 2.
Table 2. Detection of viral RNA by generic RT-qPCR in water samples of infection experiments 1 (a) and 2 (b) and (c) detection of viral infectivity in selected RT-qPCR-positive water samples obtained from experiments 1 and 2.
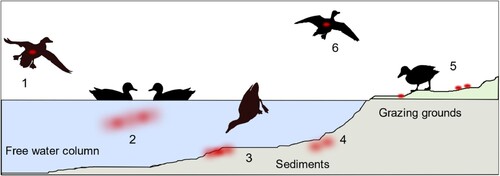
Figure 5. Schematic view of entry (1), dispersal (2–5) and exit (6) of avian influenza viruses within a waterbird habitat by infected aquatic wild birds. Red dots/clouds symbolize infectious virus.
Supplemental Material
Download MS Word (933.5 KB)Data availability statement
All data pertinent to this study are presented in tables and figures in the main text or in the supplementary materials.