
Figures & data
Figure 1. Sampling locations of the Mongolia A/MN/H5N6/2018-19 indicated with red circles (A/duck/Ugii lake/#66/2018/H5N6; A/duck/Khunt lake/#500/2019/H5N6), Mongolia/H5N6/2020 indicated with yellow circles (A/Whooper swan/Mongolia/24/2020/H5N6; A/Swan goose/Mongolia/02/2020/H5N6), and Xinjiang, China viruses indicated with violet circle (A/goose/Xinjiang/12.24_WLMQXL003-C/2018/H5N6-mixed). These sampling sites were close to the site where the novel H5N6/2020 isolates were collected with both sites being separated by about 90 km. Map was edited from Google Maps; March, 15, 2022 (https://www.google.com/maps/d/edit?hl=en&mid=1ZZ4NSJSmmXZo5lbR5GidJWsy422SceyE&ll=28.563846898417626%2C85.17260164694872&z=4).
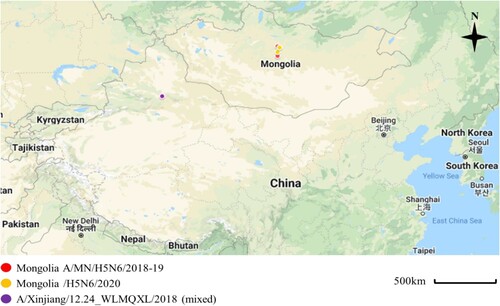
Table 1. Closest relatives to our viral nucleotide sequences from A/MN/H5N6/2018-19 in the GenBank databases and GISAID.Table Footnotea
Figure 2. The HA and NA gene maximum clade credibility tree for the A/MN/H5N6/2018-19 viruses was constructed using the BEAST 1.10.4 software package (https://beast-dev.github.io/beast-mcmc). Node bars indicate a 95% posterior density for each node height and the coloured of each branch indicate its posterior probability. Both H5N6 isolates reported in this study are shown in orange, the human H5 in red and the MN/H5N6/2020 in blue. The tMRCA is indicated at the bottom of the tree, and was estimated using the Bayesian Markov chain Monte Carlo method in BEAST 1.10.4.
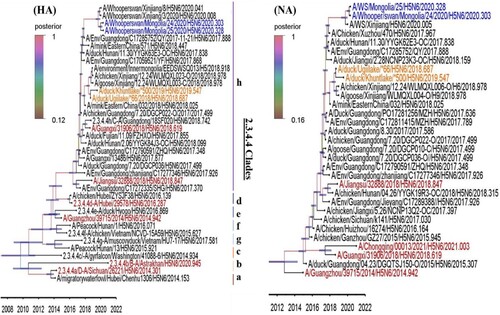
Table 2. Date of isolation for the most recent common ancestor for the HPAIVs H5N6 Mongolia/ 2018–2019 and Xinjiang/2018 viruses when using the surface gene as the comparator.
Table 3. Molecular characteristics of the HPAI A/MN/H5N6/2018-19 isolates identified in this study.
Figure 3. Comparison of H5N6 Mongolia 2019 isolate pathogenicity and Human isolate pathogenicity in a mouse model. Each group of five 6-week-old mice were inoculated via the intranasal route with between 101 and 106 EID50 per mouse for each virus in each mouse and then evaluated for survival and body weight change over a 14 day period DPI. A-D, Subclade 2.3.4.4 h A/duck/Khunt lake/#500/2019(H5N6); B-E, Subclade 2.3.4.4e RG A/Guangzhou/39715/2014 (H5N6); C-F, Clade 0 RG A/Hong Kong/483/1997 (H5N1).
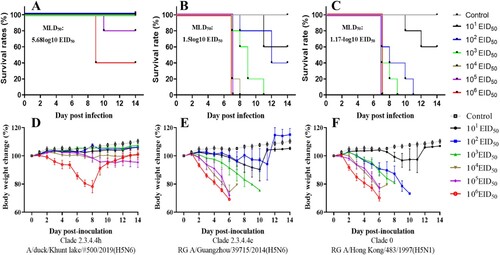
Table 4. HI evaluations of HPAI A(H5N6)/Mongolia /2019 influenza viruses using chicken antiserum.