
Figures & data
Figure 1. HBV in HBsAg intrauterine exposure group was cleared faster than that in the WT group. (A) Procedures for the generation of experimental mice. (B) Schematic diagram of the experimental process. (C) and (D) Dynamic changes of serum HBsAg and HBeAg levels in the EXP-WT group (n = 18) and WT group (n = 24) within 28 weeks post pBB4.5-HBV1.2 injection. (E) IHC of HBsAg and HBcAg in EXP-WT group (left panel) and WT group (right panel) at 12 weeks after HI. (F) Dynamic changes of serum anti-HBs levels in the EXP-WT group and WT group. *P < .05; **P < .01; ***P < .001.
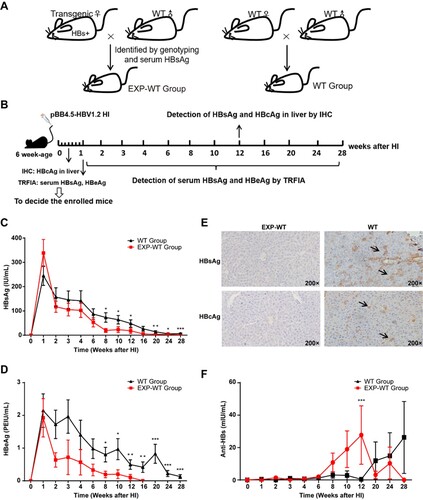
Figure 2. The HBs-specific CD8+ T cells in the liver of EXP-WT mice were significantly more than those in WT group. (A) HBs-specific CD8+ T cells isolated from the liver of WT mice and EXP-WT mice were analysed by flow cytometry. (B) and (C) Analysis of HBs-specific CD8+ T cells percentage (left) and cell counts (right) in liver of female mice (B, n = 8) and male mice (C, n = 8) in two groups. (D) The HBs-specific PD-1+ CD8+ T cells in the liver of two groups analysed by flow cytometry. (E) Comparation of PD-1 positive HBs-specific CD8+ T cells in the liver of two group mice. Left, female (n = 5); right, male (n = 5). *P < .05; **P < .01; ***P < .001.
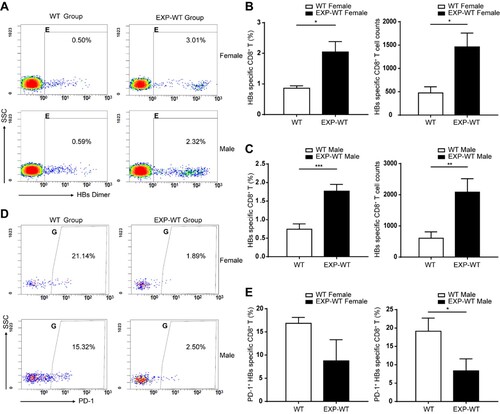
Figure 3. Immune-related genes expression in HBs-specific CD8+ T cells was significantly up-regulated in the liver of EXP-WT mice. (A) The volcano map of differentially expressed genes (log2FC > 1 and P-adjust <.05 as significant difference) detected by Smart-Seq of HBs-specific CD8+ T cells in the livers of two groups. Red dots indicated significantly up-regulated genes, green dots indicated significantly down-regulated genes, and gray dots indicated non-significantly genes. (B) Hierarchical clustering of differentially expressed immune-related genes. Relative log [FPKM (fragments per kilobase of transcript per million fragments mapped)] expression levels of genes are displayed in red–blue colour scale. (C) and (D) The differentially expressed immune-related genes from WT and EXP-WT groups were classified by Gene Ontology analysis and KEGG pathway analysis.
![Figure 3. Immune-related genes expression in HBs-specific CD8+ T cells was significantly up-regulated in the liver of EXP-WT mice. (A) The volcano map of differentially expressed genes (log2FC > 1 and P-adjust <.05 as significant difference) detected by Smart-Seq of HBs-specific CD8+ T cells in the livers of two groups. Red dots indicated significantly up-regulated genes, green dots indicated significantly down-regulated genes, and gray dots indicated non-significantly genes. (B) Hierarchical clustering of differentially expressed immune-related genes. Relative log [FPKM (fragments per kilobase of transcript per million fragments mapped)] expression levels of genes are displayed in red–blue colour scale. (C) and (D) The differentially expressed immune-related genes from WT and EXP-WT groups were classified by Gene Ontology analysis and KEGG pathway analysis.](/cms/asset/c05dd6d4-83f8-42ee-897c-a09621d3cf9a/temi_a_2071172_f0003_oc.jpg)
Figure 4. The IFN-γ-producing abilities of HBs-specific CD8+ T cells in EXP-WT mice were significantly increased than those in WT group. (A) Representative images of IFN-γ spots determined by ELISPOT in HBs-specific CTLs of 4-week-old mice. Wells added RPMI1640 without FBS were used as negative control and wells with PMA were used as positive control. (B) and (C) Comparation of the numbers (left) and intensities (right) of IFN-γ spots produced by HBs-specific CTLs between 4-week-old EXP-WT mice and WT mice. (B), female mice. (C), male mice. (D) Representative images of IFN-γ Spots in HBs-specific CTLs determined by ELISPOT assay in HBs-specific CTLs at 7 days after stimulation (n = 8). (E) and (F) Comparation of the numbers (left) and intensities (right) of IFN-γ spots produced by HBs-specific CTLs after stimulation between 4-week-old EXP-WT mice and WT mice. (E), female mice. (F), male mice. *P < .05; **P < .01; ***P < .001.
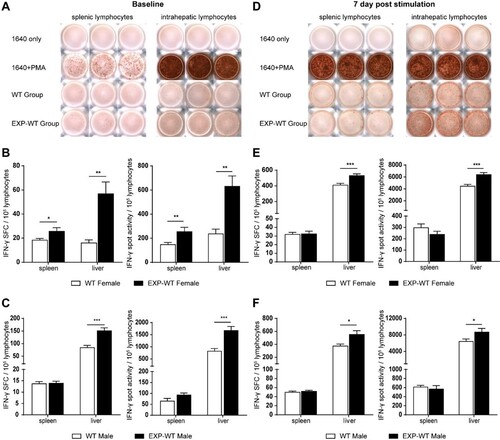
Figure 5. More HBs-specific CD8+ memory T cells in the liver of EXP-WT mice were detected than WT mice. (A) Central memory T cells (Tcm) and effector memory T cells (Tem) in HBs-specific CD8+ T cells in the livers of WT mice (left) and EXP-WT mice (right) were analysed by flow cytometry after 7 days HBsAg stimulation. (B) Analysis of the percentage of Tcm and Tem in HBs-specific CD8+ T cells in the liver of two groups of female mice. (C) Statistical analysis of the percentage of Tcm and Tem in HBs-specific CD8+ T cells in the liver of two groups of male mice. *P < .05; **P < .01.
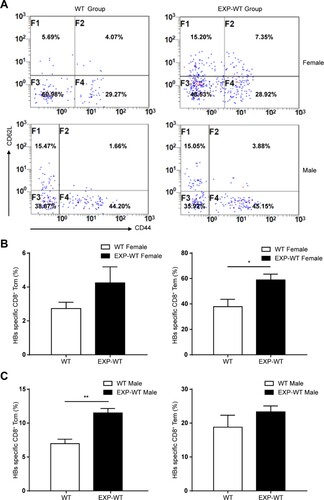
Figure 6. The antigen presentation ability of DCs in EXP-WT group mice was stronger. (A) Analysis of mature DCs populations isolated from spleen and liver in 4-week-old WT group (left) and EXP-WT group (right) (female, n = 3; male, n = 3). (B) Comparation of the mature DCs populations of in spleen (left) and liver (right) (A) between two groups of mice. (C) Relative expression level of DC-Asgpr in 4-week-old female (left) and male (right) mice of WT group and EXP-WT Group (n = 7). (D) Analysis of the expression of CD301 on the surface of DCs in the liver of mice in the WT group and EXP-WT group (n = 3). (E) Comparation of the CD301+ DCs of (D) between two groups of mice. (F) Analysis of the CD86 expression on the surface of mature DCs in the liver of female (left) and male (right) mice in both groups per week after HBsAg stimulation. *P < .05; **P < .01.
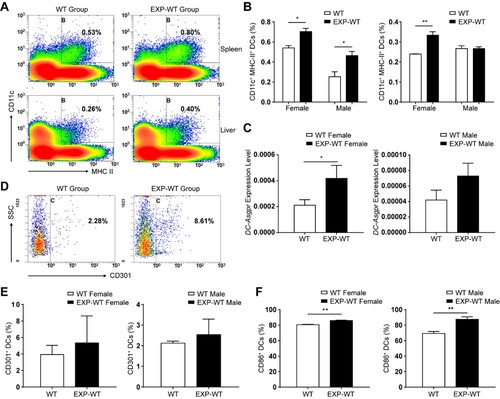
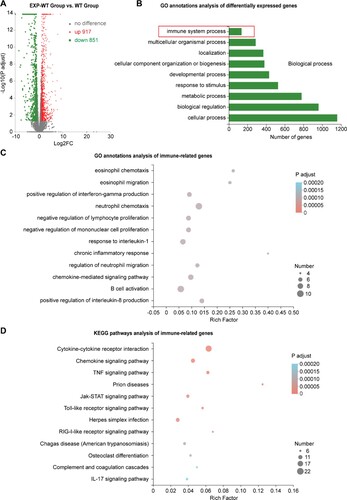
Figure 7. Significant differences in the expression of immune-related genes in the liver tissues of fetal EXP-WT group mice and WT group mice. (A) The volcano map of 1768 differentially expressed genes (DEGs) in two groups. Each point in the figure represented one gene, 917 red dots indicated significantly up-regulated genes, 851 green dots indicated significantly down-regulated genes. (B) Histogram of GO enrichment classification statistics of DEGs. The results showed that the DEGs related to “immune system progression” were enriched in Biological process classification. (C) Bubble chart of GO enrichment of immunity-related DEGs in fetal liver of two groups. (D) Bubble diagram of the KEGG pathway of DEGs related to immune in two groups. The DEGs in each group have statistically significant differences.
Supplemental Material
Download MS Word (4.6 MB)Data availability statement
The Smart-seq data of 300–1000 CD11c+ cells sorted from mice liver of two groups in the study were deposited in the SRA (www.ncbi.nih.gov.sra) repository, with accession number PRJNA754108. The Smart-seq data of 300–1000 HBs-specific CD8+ T cells sorted from mice liver and RNA sequencing data of total RNA extracted from fetus mice liver of two groups in the study were deposited in the GEO (www.ncbi.nlm.nih.gov/geo) database, with accession number GSE162718 and GSE162717 respectively.