
Figures & data
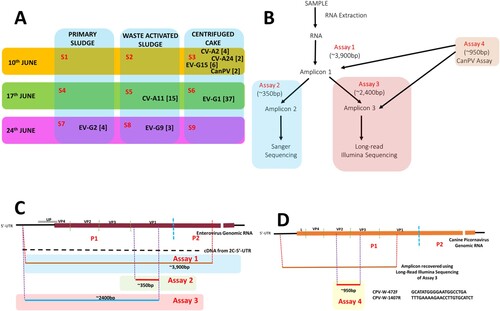
Figure 1. (A) Virus types detected in this study. S1-S9 refer to Samples 1-9. Numbers in bracket refer to the number of variants per virus type. (B) Schematic representation of the workflow used in this study, (C) EV genomic region amplified by Assays 1, 2 and 3, respectively (D) and CanPV genomic region recovered by long-read Illumina sequencing of amplicon from assay 3 and amplified by assay 4.
Supplemental material
Supplemental Material
Download MS Word (9.9 MB)Data availability statement
Sequences generated from this study are available in NCBI GenBank under accession numbers OK554433 – OK554505 and OM782676.