Figures & data
Figure 1. The molecular epidemiological characteristics of S. aureus strains isolated from nares. (A) The MLST types of the test strains. (B) Maximum likelihood tree of ST188 clonotype S. aureus isolates. This tree was built with a maximum likelihood method with a GTR substitution model utilizing SNPs of the 18 isolates. The NGS raw data were mapped with the genome of S. aureus reference MW2.
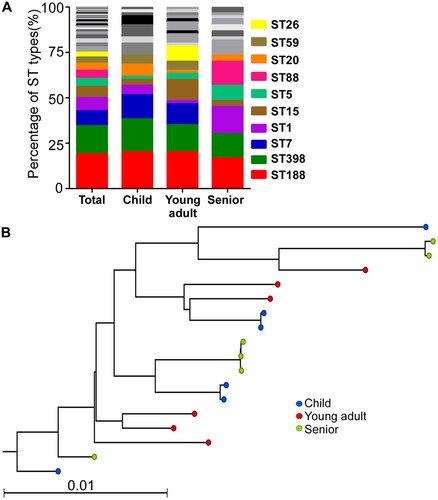
Figure 2. The content of virulence genes (A-C) and hemolytic activity of S. aureus isolates (D-F). (A-C) The gene content was determined by PCR for 16 enterotoxins 10 adhesins (A), and 6 hemolysins (B). The red-colored genes show a significantly lower occurrence in the senior isolates, whereas the blue-colored gene shows a higher occurrence. (C-E) The hemolytic activity of all S. aureus isolates (C), ST188 (D), and ST398 (E). The results are representative of three independent experiments with four replicates. The statistical significance was measured by the one-way analysis of variance (ANOVA). Error bars show the mean ± SD (*p < 0.05; **p < 0.01; ***p < 0.001).
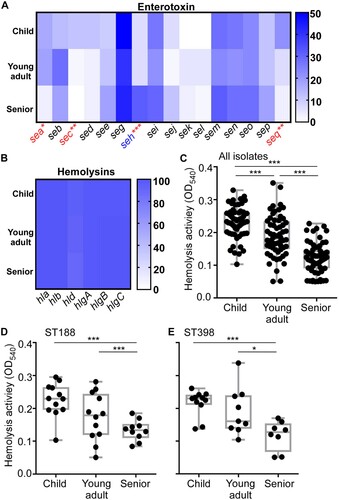
Figure 3. The transcription profiles of hemolysin regulators (A) and the Sae target genes (B). Cells were grown in TSB to exponential growth phase (OD600 = 2); then, the transcript levels were determined by qRT-PCR for saeS, saeR, RNAIII, rot, rsp, sarS, coa, and nuc genes. The coa and nuc genes are known Sae-targets. The statistical significance was measured by the one-way analysis of variance (ANOVA) (*p < 0.05; **p < 0.01; ****p < 0.0001).
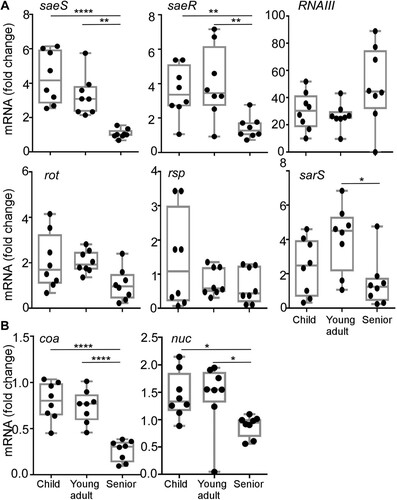
Figure 4. Comparison of the virulence of the S. aureus isolates in a murine skin abscess model. (A) The infected mice on day 3 post-infection. Eight strains were randomly selected from the isolates of each group and subjected to the virulence test. Each mouse (one mouse/isolate) was intradermally injected with the test strain (108 CFU) on the left dorsum. (B) The abscess size (i.e. length (L) × width (W)) on day 3 post-infection. (C) CFU normalized by the weight of tissues in the lesion on day 3 post-infection. (D) Effect of sae- deletion on bacterial virulence test. ST398-N7-25-5 and its sae-deletion mutant (108 CFU) were administered intradermally on the left dorsum of six mice. The infected mice (6 mice for N7-25-5 and 6 mice for the sae deletion mutant) were shown at day 3 post-infection. (E) The abscess size (i.e. length (L) × width (W)) on day 3 post-infection. (F) CFU normalized by the weight of tissues in the lesion on day 3 post-infection. The statistical significance was measured by the one-way analysis of variance (ANOVA) or unpaired t-test (*p < 0.05; **p < 0.01; ****p < 0.0001). Error bars show the mean ± SD.
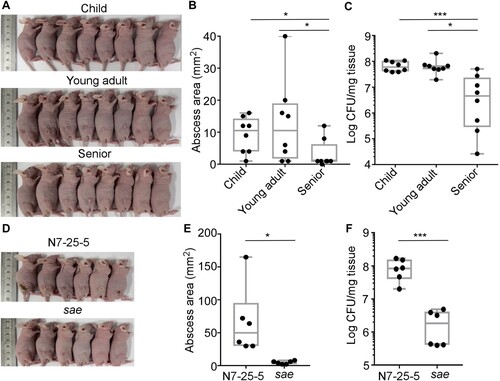
Figure 5. Comparison of the colonization and adhesion of the S. aureus isolates. (A) The senior group isolates better colonize mouse nares. Eight strains were randomly selected from the isolates of each group and subjected to the mouse colonization model. The test strains were grown in TSB until the exponential growth phase. After washing, the bacteria (108 CFU) were administered into the nares of each mouse (one mouse/isolate).The colonized bacteria in the nares were determined on day 3 post-infection. The statistical significance was measured by the one-way analysis of variance (ANOVA). **p < 0.01; ****p < 0.0001. (B) The effect of the sae-deletion on the nasal colonization of S. aureus. The test strain ST398 (N7-25-5) and its sae-deletion mutant (sae) (108 CFU) were administered into the nares of the mice (n = 3). Statistical analysis was carried out by unpaired t-test (***p < 0.001). Error bars show the mean ± SD. (C) The isolates from the senior group displayed better adhesion to nasal epithelial cells. The epithelial cells were incubated with the bacterial strains for 2 h; then, the CFU of bacteria associated with RPMI2650 epithelial cells was measured. (D) The invasion of bacteria does not affect the age group-dependent CFU increase shown in (C). In the invasion assay, external bacteria were eliminated by lysostaphin treatment before CFU counting. The statistical significance was measured by the one-way analysis of variance (ANOVA). **p < 0.01. (E) Sae negatively affects staphylococcal adhesion to RPMI2650 cells. (F) Sae does not affect staphylococcal invasion into RPMI 2650. The data are representative of two independent experiments. Statistical analysis was carried out by unpaired t-test (*p < 0.05).
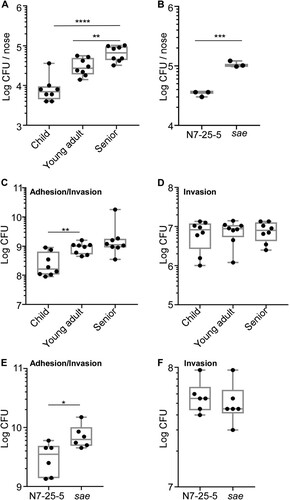
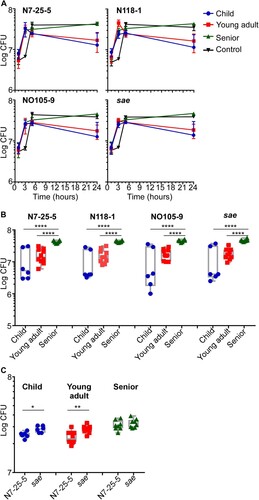
Figure 6. Survival of S. aureus in nasal secretion suspensions. Nasal secretions were collected from children, young adults and seniors and suspended in PBS. Four S. aureus strains were used for the assay: ST398-N7-25-5 and its sae mutant, ST398-N118-1, and ST398-NO105-9. The test strains were incubated in the nasal secretion suspensions, and their survival was measured by CFU counting. (A) Average CFU counting; (B) CFU counting of individual samples in the 24 h samples; (C) CFU counting of ST398-N7-25-5 and sae-deletion mutant in nasal secretion samples from children, young adults, and seniors after incubation for 5 h. Control, the synthetic nasal medium (SNM3) was used as blank control. The statistical significance of the survival difference was examined by an unpaired t-test. *p < 0.05; **p < 0.01; ****p < 0.0001. The error bars represent the mean ± SD.