Figures & data
Figure 1. Transcriptomic characteristics of patients with HBV-ACLF. (A) Study design and patient group allocation. (B) Principal component analysis of subjects in the ACLF, LC, CHB and NC groups. (C) Hierarchical clustering analysis of subjects in the ACLF, LC, CHB and NC groups. (D) Number of DEGs analysed in pairwise comparisons among the four groups. (E) Venn diagram of the DEGs analysed in pairwise comparisons among subjects in the ACLF vs. CHB and ACLF vs. LC. (F) Biological pathways on ClueGO functional analyses from the overlapping up-regulated DEGs of ACLF vs. CHB and ACLF vs. LC. Abbreviations: ACLF, acute-on-chronic liver failure; CHB, chronic hepatitis B; DEGs, differentially expressed genes; HBV, hepatitis B virus; LC, liver cirrhosis; NC, normal controls.
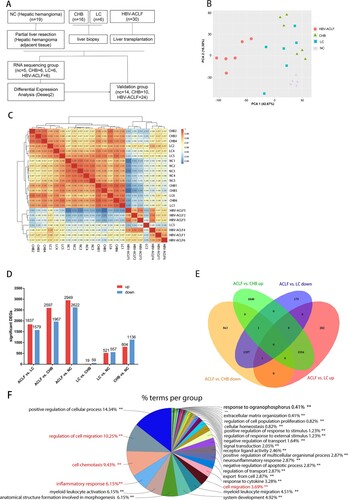
Figure 2. Transcriptome sequencing data analysis indicated the important role of inflammation and chemotaxis in the development of HBV-ACLF. The overlapping up-regulated DEGs of ACLF vs. CHB and ACLF vs. LC were analyzed for enrichment of (A) GO molecular functions and (B) KEGG pathways. (C) Protein–protein association network of DEGs related to chemotaxis from the overlapping up-regulated DEGs of ACLF vs. CHB and ACLF vs. LC. (D) Heatmap of chemokine and chemokine receptor genes among ACLF, LC, CHB and NC groups. (E) The volcano plot showing the expression of the key chemokines (CXCL8, CCL2, CCL5, CCL20, CXCL5, CXCL6) associated with ACLF between HBV-ACLF vs. CHB (left) and HBV-ACLF vs. LC (right). Abbreviations: ACLF, acute-on-chronic liver failure; CHB, chronic hepatitis B; DEGs, differentially expressed genes; HBV, hepatitis B virus; LC, liver cirrhosis; NC, normal controls; GO: gene ontology; KEGG: Kyoto Encyclopedia of Genes and Genomes.
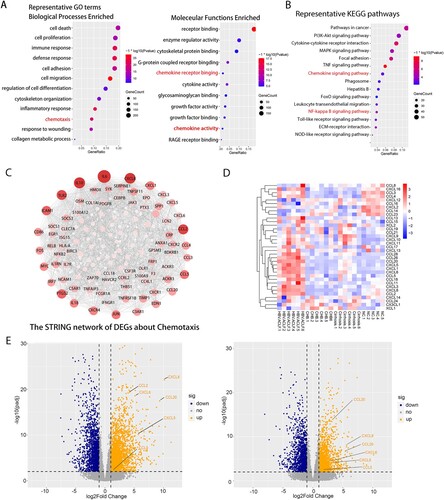
Figure 3. The comparison of transcriptomic data between ACLF-1 and ACLF-2/3. (A) Principal component analysis of subjects in the ACLF-1 and ACLF-2 groups. (B) Hierarchical clustering analysis of subjects in theACLF-1 and ACLF-2 groups. (C) The volcano plot between ACLF-1 and ACLF-2/3. GO enrichment analysis of the up-regulated DEG (D) and down-regulated DEG (E). KEGG enrichment analysis of the up-regulated DEG (F) and down-regulated DEG (G). Patients 1, 3, and 6 belong to ACLF-1, and patients 2, 4, and 5 belong to ACLF-2., Abbreviations: ACLF, acute-on-chronic liver failure; GO: gene ontology; KEGG: Kyoto Encyclopedia of Genes and Genomes; DEGs, differentially expressed genes;
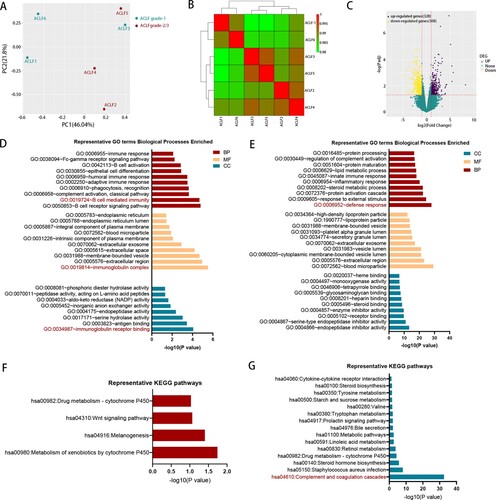
Figure 4. The liver of HBV-ACLF patients exhibited significantly increased chemokines, a large number of inflammatory cell infiltration and high activation of the NF-ĸB pathway. (A) The qRT-PCR validation of 10 key chemokine genes (n = 24/10/14, ACLF/CHB/NC groups, respectively). (B,C) Liver HE staining in patients from the HBV-ACLF, CHB, and NC groups. (D) Immunohistochemical staining of T lymphocytes (CD3), macrophages (CD68), neutrophils (CD15), and NK cells (CD56) in the liver of patients from the HBV-ACLF, CHB, and NC groups. (E) ELISA results of plasma IL-6, IL-8, and IL-1β in HBV-ACLF, CHB patients, and NC. Plot, medians with (p25, p75). The Kruskal–Wallis test, *p < 0.05, **p < 0.01 and ***p < 0.001. (F) Immunoblot analysis of HBV-ACLF, CHB, and NC livers for p-P65 and P65. Abbreviations: ACLF, acute-on-chronic liver failure; CHB, chronic hepatitis B; DEGs, differentially expressed genes; HBV, hepatitis B virus; LC, liver cirrhosis; NC, normal controls; HE; RT-PCR;
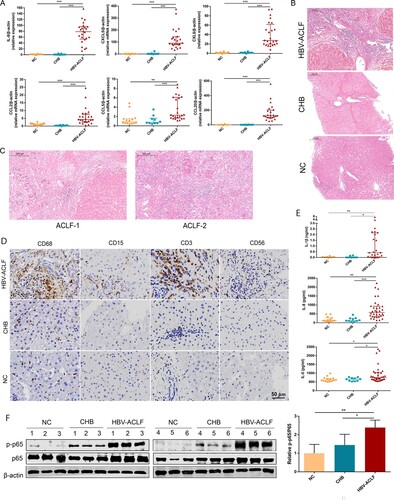
Figure 5. CYLD expression in liver and PBMC was down-regulated in HBV-ACLF patients. (A) Immunoblot analysis of HBV-ACLF, CHB, and NC livers for CYLD. (B) Immunohistochemical staining of CYLD in the liver of patients from the HBV-ACLF, CHB, and NC groups. (C) The qRT-PCR of CYLD in the PBMC of patients from the HBV-ACLF, CHB, and NC groups. (D) Immunohistochemical staining of CYLD and CD68 in the liver of patients from the HBV-ACLF, CHB, and NC groups. (E) Immunohistochemical staining of CYLD in Huh7 and THP-1. (F) ELISA results of plasma LPS in HBV-ACLF, CHB patients, and NC. Plot, medians with (p25, p75). The Kruskal–Wallis test, *p < 0.05, **p < 0.01 and ***p < 0.001. Abbreviations: Cylindromatosis (CYLD), ACLF, acute-on-chronic liver failure; CHB, chronic hepatitis B; DEGs, differentially expressed genes; HBV, hepatitis B virus; LC, liver cirrhosis; NC, normal controls; PBMC, peripheral blood mononuclear cell; LPS, lipopolysaccharide.
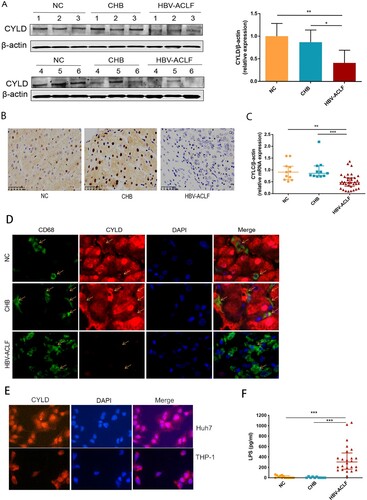
Figure 6. Depletion of CYLD enhanced inflammatory response by enhancing NF-ĸB activation. THP-1 (8 × 10⁵ cells/ml) were seeded in 6-well cell culture plate added with PMA (100 ng/mL) for 24 h, then were stimulated with LPS (100 ng/mL) and lysed for collecting cell lysates and supernates at different time point within 48 h. Protein levels of p65, p50 and Phospho-p65 were detected in the nucleus and cytoplasm, respectively. CYLD knockdown in THP-1 significantly enhances NF-ĸB activation (A), increases the production of pro-inflammatory cytokines (B) and chemokine (C). Supernates from CYLD-depleted macrophages stimulated by LPS for 6 h exhibited an enhanced chemotactic migratory effect on immune cells from normal human peripheral blood (D). Values are shown as fold change from control and expressed as the mean, n = 3 (a single sample analysed in triplicate); bars show SD. *P < 0.05, **P < 0.01, ***P < 0.001. Abbreviations: PMA, Phorbol 12-myristate 13-acetate; LPS, lipopolysaccharide. CYLD, Cylindromatosis.
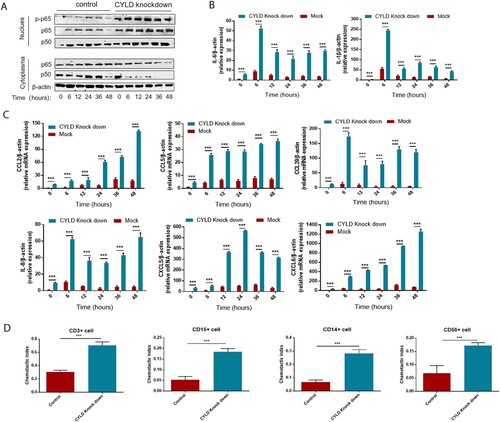
Figure 7. Blocking NF-ĸB in THP-1 attenuated the excessive inflammatory response caused by CYLD downregulation. THP-1 (8 × 10⁵ cells/ml) were seeded in 6-well cell culture plate added with PMA (100 ng/mL) for 24 h, then JSH-23 (an inhibitor of NF-κB nuclear translocation, 20 μM) was then added 3 h before stimulation with LPS (100 ng/mL). Cell lysates and supernates were collected at 6 h after LPS stimulation. Phospho-p65, p50 and p65 of nuclear and cytoplasmic fractions were detected respectively. NF-ĸB activation was suppressed in both CYLD-depleted and control THP-1 cells (A). The majority of chemokines (CCL2, CCL5, CCL20, CXCL5, CXCL6 and CXCL8) and cytokines (IL-6 and IL-1β) were suppressed in both CYLD-depleted and control THP-1cells. Values are shown as fold change from control and expressed as the mean, n = 3 (a single sample analysed in triplicate); bars show SD. Abbreviations: CYLD, Cylindromatosis; PMA, Phorbol 12-myristate 13-acetate; LPS, lipopolysaccharide.
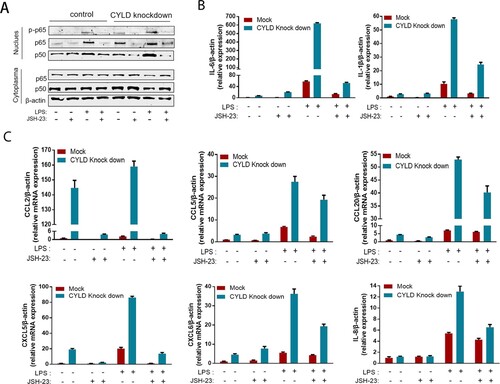
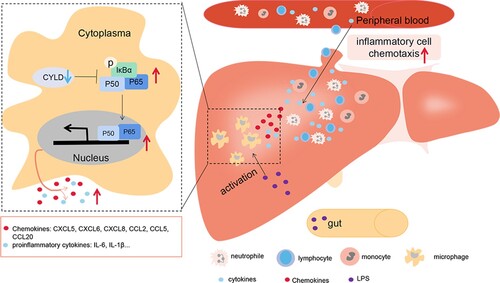
Figure 8. Illustration of how down-regulated CYLD induces a hyperinflammatory response in HBV-ACLF patient. PAMP from intestinal bacterial products (such as LPS) and DAMP molecules from necrotic hepatocytes activate intrahepatic macrophages, leading to the activation of NF-ĸB in macrophages. NF-ĸB activation remains sustained due to the down-regulated CYLD in HBV-ACLF patients, leading to high level of secretion of chemokines and pro-inflammatory factors. Chemokines attract a large number of inflammatory cells including lymphocytes, neutrophils, monocytes and NK cells to infiltrate the liver, thus aggravating tissue damage of the liver. Abbreviations: PAMP, pathogen-associated molecular patterns; DAMP, damage-associated molecular pattern; CYLD, Cylindromatosis; LPS, lipopolysaccharide; ACLF, acute-on-chronic liver failure; CHB, chronic hepatitis B; HBV, hepatitis B virus.